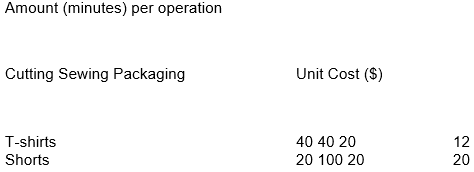
1. A clothing garment factory produces T-shirts and shorts for the chain of Coles supermarkets. The contract is such that quality control is done before shipping and all products supplied to Coles satisfy the quality requirements would be accepted by the chain. The factory employs 20 workers in the cutting department, 52 workers in the sewing department, and 14 workers in the packaging department. The garment factory works 8 productive hours a day (no idle time during these 8 hours). There is a daily demand for at least 200 T-shirts. Each worker can participate only in one activity- the activity to which they are assigned. The table below gives the time requirements (in minutes) and profit per unit for the two garments.
a) Explain why a Linear Programming (LP) model would be suitable for this case study.
b) Formulate a LP model to help the factory management to determine the optimal daily production schedule that maximises the profit while satisfying all constraints.
c) Use the graphical method to find the optimal solution. Show the feasible region and the optimal solution on the graph. Annotate all lines on your graph. What is the optimal daily profit for the factory?
Note: you can use graphical solvers available online but make sure that your graph is clear, all variables involved are clearly represented and annotated, and each line is clearly marked and related to the corresponding equation.
d) Find the range for the profit ($), of a T-shirt (if any), that can be changed without affecting the optimal point of part (c)?
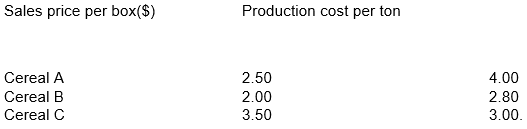
2. A food factory makes three types of cereals, A, B and C, from a mix of several ingredients:
Oates, Apricots, Coconuts and Hazelnuts. The cereals are packaged in 2kg boxes. The following table provides details of the sales price per box of cereals and the production cost per ton (1000 kg) of cereals respectively.
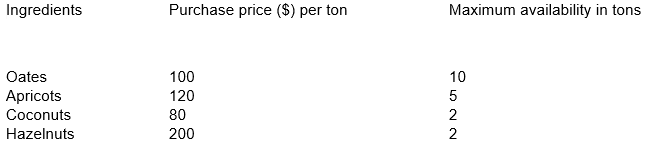
The following table provides the purchase price per ton of ingredients and the maximum availability of the ingredients in tons respectively.
The minimum daily demand (in boxes) for each cereal and the proportion of the Oates, Apricots, Coconut and Hazelnuts in each cereal is detailed in the following table, Proportion of
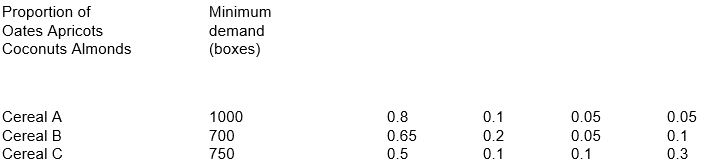
a) Let xij ≤ 0 be a decision variable that denotes the number of kg of ingredient i, where i could be Oates, Apricots, Coconuts, Hazelnuts, used to produce Cereal j, here j is one of A,B,C, (in boxes). Formulate an LP model to determine the optimal production mix of cereals and the associated amounts of ingredients that maximises the profit, while satisfying the constraints.
b) Solve the model in R/R Studio. Find the optimal profit and optimal values of the decision variables.
3. Two mining companies, Fox and Trot, bid for the right to drill a field. The possible bids are $ 15 Million, $ 25 Million, $ 35 Million, $ 45 Million and $ 50 Million. The winner is the company with the higher bid.
The two companies decide that in the case of a tie (equal bids), Fox is the winner and will get the field.
Fox has ordered a geological survey and, based on the report from the survey, concludes that getting the field for more than $ 45 Million is as bad as not getting it (assume loss), except in case of a tie (assume win).
(a) State reasons why/how this game can be described as a two-players-zero-sum game.
(b) Considering all possible combinations of bids, formulate the payoff matrix for the game.
(c) Explain what is a saddle point. Verify: does the game have a saddle point?
(d) Construct a linear programming model for Company Trot in this game.
(e) Produce an appropriate code to solve the linear programming model in part (d).
(f) Solve the game for Trot using the linear programming model and the code you constructed in parts (d) and (e). Interpret your solution.
4. Consider two factories, Factory A and Factory B, producing the same model of iPads. The demand for the iPads produced by Company A is DA, and the demand for the iPads produced by Company B is DB. The demands are described by the following functions:
DA = 200 – PA – (PA – P¯) (1)
DB = 200 – PB – (PB – P¯) (2)
where PA and PB are the prices of iPad for Factory A and Factory B respectively, and P¯ is the average price over the prices PA and PB. For each company, the cost for producing one iPad is C = 20. Suppose that each company can only choose one of the three prices f60; 70; 80g for a sale.
(a) Compute the profits of each factory under all sale price combinations and produce the payoff matrix for each company.
[Hint: the profit = the demand for the cellphones × the profit of one cellphone after sale.]
(b) Find the Nash equilibrium of this game. What are the profits at this equilibrium? Explain your reason clearly.
(C) If the cost C = 30, would the Nash equilibrium from part (b) change? Give clear reasons.
Students succeed in their courses by connecting and communicating with an expert until they receive help on their questions

Consult our trusted tutors.


 Login | Sign Up

