1. Create an Expectation Management Matrix in a table format using the data below. Use as a sample the Table 13-3 on page 549 of Schwalbe's textbook. You could modify and extend with additional measures of success, such as achieving customers' satisfaction, exceeding ROI projections, and accomplishing great quality expectations.
Write a page Memo to the stakeholders introducing to them the Expectation Management Matrix. You and your team are continuing your work on the Global Treps Project. Your project sponsor, Dr. K., has asked you to refine the existing cost estimate for the project so you can evaluate supplier bids and have a solid cost baseline for evaluating project performance. Recall that your schedule and cost goals are to complete the project in six months for under $120,000. You planned to use up to $50,000 total to pay yourself and your team members, and your initial estimates were $30,000 for travel expenses, $20,000 for hardware and software, and $20,000 for organizing four events, including consultants, legal/business fees, etc.
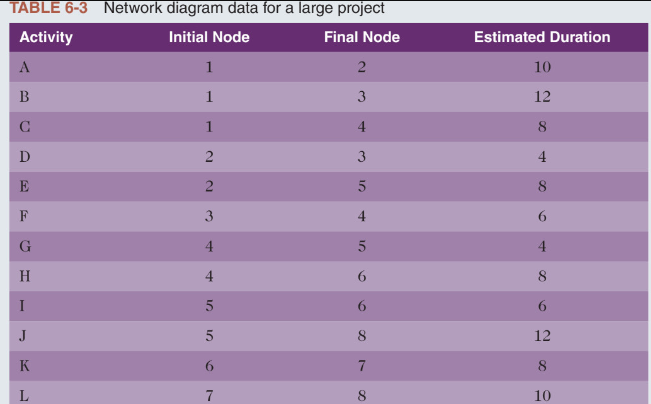
2. Create Final Project Closeout Report based on templates from the Schwalbe's textbook. Use as project information the data below, and prepare a professional looking Final Project Closeout Report for concluding the project. Assume the project is finished on time (for 6 months) and on budget ((total project cost $ 120 K) as it was initially planned. This task should be integrated in one MS Word file and should include: 2.1 Final report with executive summary, review analysis, and recommendations 2.2 Project Deliverable 2.3 Client acceptance form 2.4 Lessons learned report. Ex.3 Consider Table 6-3. All duration estimates or estimated times are in weeks, and the network proceeds from Node 1 to Node 8. (Note that you can easily change this table to create multiple exercises.)
a. Draw an AOA network diagram representing the project. Put the node numbers in circles and draw arrows from node to node, labeling each arrow with the activity letter and estimated time.
b. Identify all of the paths on the network diagram and note how long they are, using Figure 6-8 as a guide for how to represent each path.
c. What is the critical path for this project and how long is it?
d. What is the shortest possible time needed to complete this project? Enter the information from Exercise 3 into Project 2016.
View the network diagram and task schedule table to see the critical path and float or slack for each activity. Print the Gantt chart and network diagram views and the task schedule table. Write a short paper that interprets this information for someone unfamiliar with project schedule management.
Students succeed in their courses by connecting and communicating with an expert until they receive help on their questions

Consult our trusted tutors.


 Login | Sign Up

