Equilibrium Dialysis analysis of a monoclonal antibody binding to a peptide antigen
A 15 amino acid peptide from a coat protein of a newly identified virus was couple to BSA (as a carrier) for immunization of a mouse. After a first injection followed by a booster, a test bleed was carried out and the serum was tested by ELISA for antigen binding. As a good response was detected, the mouse spleen was harvested, B cells were isolated, fused with myeloma cells and selected on HAT media. Resulting hybridoma cells were clonally selected and screened by ELISA for high affinity antigen binding. Ten high affinity clones were identified and
IgG antibodies were purified from each one for more detailed analysis by equilibrium dialysis.
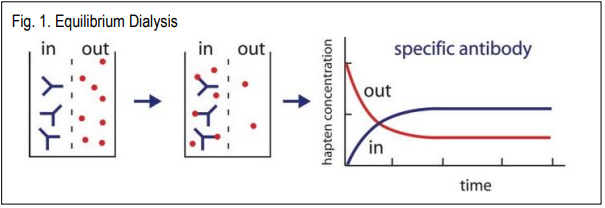
A 100 µl volume of each purified antibody was placed in 4.9 ml of buffer on the “in” side of 4 dialysis chambers (i.e. quadruplicate measurements). Increasing concentrations of radioactive peptide antigen were added stepwise to the “out” side of the chambers. After each step, the system was allowed to equilibrate and 50 µl samples were collected from both sides of the membranes and antigen counts were determined in a scintillation counter. Specific activity of the radioactive small antigen was 10,000 cpm/nmole (counts per minute per nanomole (10-9 moles). Data obtained are all expressed as cpm (per 50 µl sample).
Your job is to analyse this data and determine the Kd (dissociation constant (1/Ka)) and Bmax (maximal binding) for the antigen-antibody interaction of one of these antibodies, using two different graphical methods:
1. Scatchard linear regression
2. Non-linear regression using the 4-parameter logistic or Hill equation
Your final Kd and Bmax values should be expressed as nM (or x 10-9M). Make sure to account for the specific radioactivity and the sample volume. This conversion can be done just at the end, so your graph x axes will be in cpm, or it can be done to all the data at the start, so your graph x axes will be in nM.
Method
1. Obtain your data for the assigned data set from the list on Canvas. If you are not sure, please contact Brett Cromer (bcromer@swin.edu.au). The data is provided as an Excel spreadsheet, with columns set out to help you with the format of your calculations.
2. Subtract the concentration of “Free” antigen (Out side measure) from the concentration of “Bound + Free” antigen (In side measure). Each of the 4 columns represent separate separate dialysis setups so subtract 1 from 1, then 2 from 2 etc. Record the values as concentration of “Bound” antigen in corresponding columns 1-4.
3. Derive the data for the Scatchard analysis by calculating the bound-to-free antigen ratio i.e. “Bound / Free”. Once again divide column 1 from 1, then 2 from 2 etc.
4. Now you need to calculate the average (mean) and the standard error in the mean (SEM) for each of the three sets of data you will plot:
a. “Bound + Free” i.e. the total antigen concentration
b. “Bound” - antigen bound to the receptor
c. “Bound / Free”
5. SEM is calculated as =STDEV(4 values)/SQRT(n). As n=4, SEM = STDEV(4 values)/2
6. Now graph average Bound (Y) vs “Bound + Free”(X), X axis on a Log10 scale.This should give a sigmoidal curve showing the saturation curve of your data towards Bmax. Please also add SEM error bars, which is a bit tricky in Excel. Click on the graph: ┼ @ top right, error bars ►more options, custom – specify value, paste in the SEM data location in both plus and minus bars for the Y axis only. (Note often you can only do one at a time – i.e. plus then come back to do minus). You may wish to set X axis error bars to a fixed value of zero to get rid of them. Whilst there are errors in the X axis, the Y errors are the most important.
7. You can get an OK fit to this sigmoidal curve ┼ @ top right, error bars ►two period moving average and can then estimate manually the Bmax and Kd (X value at half Bmax). OR
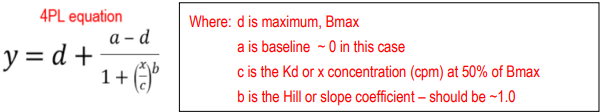
8. Much better than (7.) is to fit your data to the 4PL equation using the website https://www.mycurvefit.com/ You will need to register with your email. Then clear the data table and paste in your B and B + F data, as 2 columns with headings. You will then be asked to confirm data format, which can look wrong but make sure it ends up correctly as 2 columns. A curve will then be automatically fit. Make sure it is fit with the nonlinear 4PL equation and change the X-axis to Log scale by clicking on the X at bottom right of the graph. You can then export result as excel file, including the fit parameters.
9. Next, plot the data as Scatchard plot i.e. a plot of B/F ratio (Y) vs B (X). Plot error bars as above and fit a linear Trendline. Also use trendline - more options to show equation and Rsquared value on graph.
10. Calculate the dissociation constant (Kd) and Bmax from each graph with appropriate units (Hint: convert cpm/ 50 µL to nM using the specific activity as a conversion factor). Remember for a scatchard plot: Y intercept = Bmax/Kd, X intercept = Bmax, slope = -1/Kd
11. Present your analysis as for an experimental report showing in full how you used your data to obtain your Kd and Bmax. You must show the direct plot and all calculation as well as the Scatchard transformation that you used to estimate the Kd. Your Kd value will be marked for accuracy so beware of the significant figures. You can also use your knowledge of antibody mw and valency to determine the concentration of the antibody.
Report Requirements
Abstract
1. Must be a summary of your practical exercise
2. Must include 1-2 statements each on the background, aims, methodology adopted, key findings, conclusion and any recommendations on improvements.
Introduction
1. Must include 1-2 diagrams
2. In-text references must be provided at appropriate places and full reference entry must be given at the end of the report in the bibliography
Aims
Brief, clear statement of experiment aim.
Results, with calculations and graphs
Although you did not actually carry out the experiment, still write the results as explanative text that describes the reason for each step, what you found in the results - referring to data presented in figures - and brief interpretation of what results mean. Then leading on logically to the next result/analysis.
Results should follow logically on from the aims, with text presenting a cohesive narrative or “story”.
Discussion
1. Compare the two graphical methods for determining Bmax and Kd. How well do the two methods agree? What are advantages and disadvantages of each method and which is more reliable? What do the error bars tell you?
Conclusions
• Should directly address the aim
Methods
• Brief summary, written as if you did the experiment.
• Paragraph format as in published papers
References
• Check your in-text referencing
• Bibliography
Students succeed in their courses by connecting and communicating with an expert until they receive help on their questions

Consult our trusted tutors.


 Login | Sign Up

