A 62.5 g block connected with two springs as shown in figure below, the initial length for the two springs/ cm is 8.4 and the final length for the springs/ cm is k1 = 16.4 and k2 = 12.3
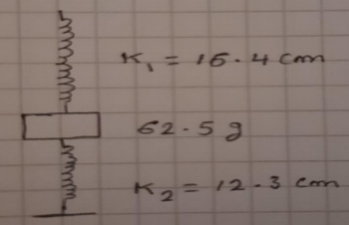
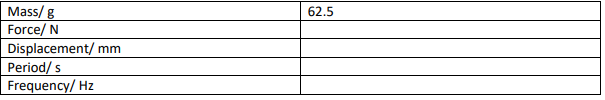
Complete the table below and plot a graph (Force vs displacement) with Excel and use the function SLOPE () to give a best estimate for the gradient through your data points.
a. explains how the spring constant was measured.
b. explains how the resonant frequency is identified.
c. a comparison of predicted results vs actual results.
d. discussion of the results with reflection on the equipment used and errors identified.
e. suggests one way the experiment could be modified to obtain improved results.
Students succeed in their courses by connecting and communicating with an expert until they receive help on their questions

Consult our trusted tutors.


 Login | Sign Up

