Eljay School
A large Australian School has recently opened an online education division called Eljay. The school provides online education services to students from around the world. In an effort to improve the services offered to students, a job management system was developed to improve the responses provided to student queries. At the end of every week, a manager from the administration team archives an excel file that contains data about student queries for that week. The manager of the administration team believes that the data within this spreadsheet would be valuable for business decision making. However, employees within the team lack the technical knowledge to analyse and interpret this data. Subsequently, the manager is unsure how to utilise this data to gain insights on how to improve response times and outcomes for students.
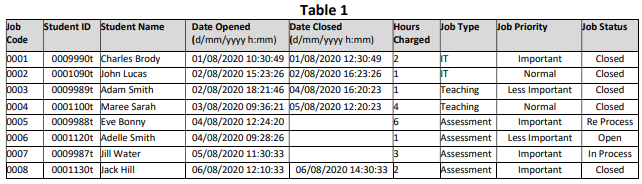
The administration team manager decided to hire you to assist in analysing and interpreting the data. The table below shows a data file that was archived containing information on student queries for one week.
While only a small number of queries were received from students in the first week of the month, student queries are expected to go up over the remainder of the month. However, before getting actual data from the job management system in the coming weeks, Eljay school has asked you to explore the possible analyses that can be performed if using the current output. Eljay provided you with a document listing specific instructions on what you are expected to do in Excel. The instructions are listed below.
Requirements
(1) Open an Excel Workbook and name it as ‘Student ID_ Student Name_ ACCT6001 Assessment 3’ (i.e. 0009989t_Adam Smith_ACCT6001 Assessment 3). Create a worksheet labelled as ‘Job Data’. Make a table similar to the one above using hypothetical details for 50 students. The table should include the following columns: Job Code, Student ID, Student Name, Date Opened, Date Closed, Job Type, Job Priority, Job Status.
In your hypothetical data, assume:
a) all student queries were made by students located in Australia,
b) at least 30 jobs that have a job status of “closed”
c) at least one of each Job Status is included in the data set for each Job Type. For example, include at least:
“open”, “in process”, “re process”, and “closed” entries for “IT”,
“open”, “in process”, “re process”, and “closed” entries for “Teaching”, and
“open”, “in process”, “re process”, and “closed” entries for “Assessment”
d) All queries are made between 01/08/2020 and 28/08/2020.
e) Each student lodges a query in the job management system only once. So, each row of data contains information about a specific student.
(2) In the ‘Job Data’ worksheet, add a column labelled as ‘Time taken to close job. This column should show the time spent resolving each job (e.g. student query). The values for this column should be reported using the “number” format and calculated using a:
a) combination of the date opened and date closed columns.
b) formula that only includes entries with a “Job Type” equal to “Closed”.
(3) Create a new worksheet in your workbook and label it as ‘Job Duration’. In this worksheet:
a) Report the descriptive statistics (i.e. mean, median, maximum, minimum) for both the “Time taken to close job” column added to the ‘Job Data’ worksheet and the “Hours Charged” column. A brief commentary on the results should be provided.
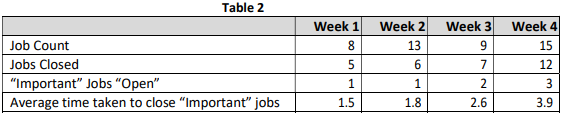
b) Include another table in this worksheet showing for each week the:
Total number of jobs,
Total number of jobs “Closed”,
Total number of “Important” jobs “Open”, and
Average time taken to close “Important” jobs.
The values for each week should be calculated using Excel formulas based on values from the ‘Job Data’ worksheet (e.g. the values in your table should change if values in the ‘Job data’ table change). The table may look like Table 2.
The administration team believe that the problem with Key Performance Indicators focused on the number of jobs closed each week was that “important” jobs were not being prioritised. Do you find support for this belief? Use a chart(s) to report the results for correlation to support your answer.
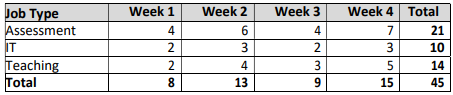
(4) Create a worksheet labelled as ‘Job Type’. Include a table in this worksheet showing the number of jobs for each week grouped by the three different job types. The values should be directly linked to the ‘Job Data’ worksheet. The table may look like Table 3.
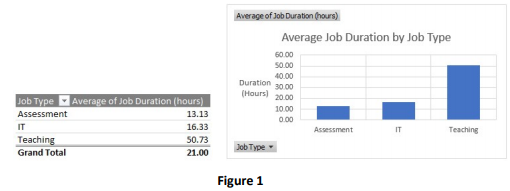
(5) Create a worksheet and label it as ‘Pivot Tables and Charts’. Build tables and charts that show the average Job Duration by Job Type and Job Priority. Provide these by creating 2 pivot tables/charts (one for each Job Type and Job Priority). Place both of these tables and charts on the same worksheet. A sample for output of Job Duration by Job Type is shown in Figure 1.
For each table/chart, comment on whether you think the school would be able to introduce a policy of no more than 2 working days (48 hours) to resolve students queries.
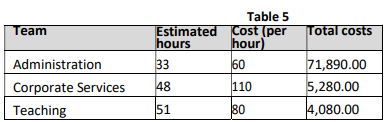
(6) Of the employees directly responsible for resolving student queries, the school currently has 3 contract-employees working in the administration team, 2 in the teaching team, and 1 in the corporate services team. Contract employees from the administration team charge the school $60 per hour, teaching team employees charge $80 per hour and corporate services $110 per hour. The administration team manager, who receives a salary of $70,000 per annum, asked you about using data from the job management system to develop a monthly budget. The following information was gathered for you to use in developing this budget.
1. “Hours charged” for “Assessment” jobs are invoiced by the administration team 60% of the time and the remaining 40% of the “Hours charged” are invoiced by the teaching team.
2. All “Hours charged” for “IT” jobs are invoiced by corporate services team
3. The “Hours charged” to “Teaching” jobs are invoiced by the teaching team 90% of the time while the remaining 10% are invoiced by the administration team.
Create a ‘Budget Summary Report’ worksheet. Include a table with a column for the Team, Estimated hours, and Total Costs. The values for the estimated hours charged column should be linked to the ‘Job Data’ worksheet. Use appropriate functions to fill out the remaining cells of the table. A sample table is shown in Table 5.
Generate a pie chart to show the distribution of expected costs across different teams.
(7) Due to the recent economic crisis around the world, the school would like to cut costs and automate several processes. Given strong industry demand for using Artificial Intelligence (AI) tools to manage customer queries, you believe that a large number of student queries could be managed using an AI bot. However, to implement this technology at the school, a part-time employee will need to be employed along with a software-as-a-service (SAAS) subscription. The part-time employee will cost $35,000 per year. However, you expect that the budgeted costs (in requirement 6) will be significantly reduced. If the school purchases the AI bot, it will half the amount of time required by the administration manager to manage student queries, reducing this cost to $35,000 per year. The percentage of “Hours charged” will also decrease for all job types and only a small charge per “Closed” job will be incurred for the SAAS subscription (as shown in Table 6).
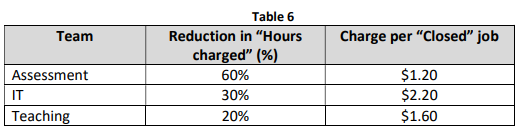
If the School does not implement the AI bot tool, the number of jobs performed by employees will remain unchanged. Do you recommend the School purchases the AI bot?
(8) Create a worksheet labelled as ‘Analysis and Recommendation’. This worksheet should contain the following three sections.
a. Findings – Briefly summarise your findings based on the analysis performed in requirement 2 to requirement 7.
b. Recommendation for additional analysis – In this section, you should comment on whether additional analyses can be performed using the types of data that the administration team manager currently receives from the job management system. You should provide one example of an additional analyses that can be performed using the given data and explain how to perform the analysis. Comment on how the additional analysis would help the administration team manager to make business decisions.
c. Recommendation for additional data – Currently there is an option for the
administration manager to get other types of data from the job management
system. Provide one practical example of an additional type of data that should
be collected about student queries (e.g. jobs). Suggest the type of analysis that
can be done using the additional data. Comment on how the analysis on
additional data would help the administration department improve business
decision making.
Students succeed in their courses by connecting and communicating with an expert until they receive help on their questions

Consult our trusted tutors.


 Login | Sign Up

