Harper County Houses Sold
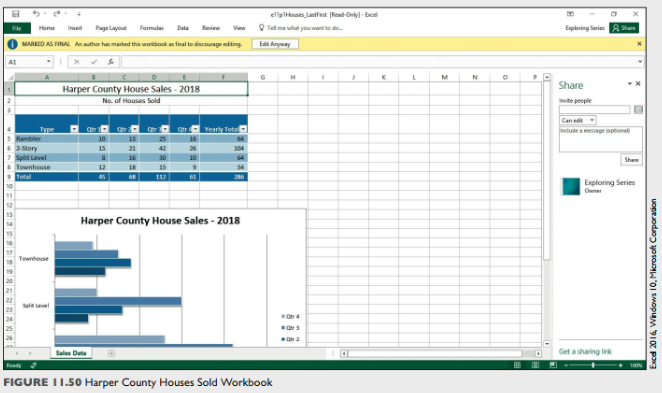
A real estate agent sent you a workbook containing sales in the county for the last year. You want to add document properties and then review it for accessibility and compatibility. You then will create a PDF file to save to OneDrive. Refer to Figure 11.50 as you complete this exercise.
a. Open e11p1Houses and save it as e11p1Houses_LastFirst. Type your name on the left side of the footer.
b. Click File, click Properties, and select Advanced Properties. Enter these properties:
• Type 2018 Harper County House Sales in the Title box.
• Type your name in the Author box.
c. Click OK, click Back, and click Save.
d. Click File, click Check for Errors, and select Inspect Document. Click Inspect in the Document Inspector dialog box. The Document Inspector finds comments and annotations, document properties and personal information, headers and footers, and hidden rows and columns.
e. Scroll down to see the different items found by Document Inspector. Click Remove All to the right of Comments and Annotations. Click Close and click the Back arrow. f. Click Select All, click Format in the Cells group on the Home tab, point to Hide & Unhide, and select Unhide Rows. Click cell A1.
g. Click File, click Check for Issues, and select Check Accessibility.
h. Complete the following set of steps to enter alternative text for the table:
• Double-click Table 1 in the Accessibility Checker task pane to select the table.
• Right-click the table, point to Table, and select Alternative Text.
• Type 2018 House Sales in the Title box in the Alternative Text dialog box.
• Type Number of houses sold in each category during each quarter. in the Description box.
• Click OK.
i. Complete the following set of steps to enter alternative text for the chart:
• Double-click Chart 1 in the Accessibility Checker task pane to select the chart.
• Double-click the chart to display the Format Chart Area task pane.
• Click Size & Properties and click Alt Text.
• Type 2018 House Sales in the Title box.
• Type Bar chart showing number of houses sold in each category during each quarter. in the Description box.
• Close the format Chart Area task pane.
j. Close the Accessibility Checker task pane and click any cell within the worksheet
k. Click the File tab, click Protect Workbook, and select Mark as Final. Click OK and then click OK.
l. Click the File tab, click Export, and then click Create PDF/XPS. Accept the default name, e11p1 Houses_LastFirst, and click Publish. Close the PDF Reader program and keep the Excel workbook open.
m. Click Share in the top-right corner of the window and click Save to Cloud. Click OneDrive Personal, select a folder, and click Save. The Share task pane displays. Click in the Invite people box and enter your instructor's email address. Click Share.
n. Close the file. Based on your instructor's directions, submit the following:
e11p1Houses_Last First
e11p1Houses_LastFirst.pd


 Login | Sign Up

