Part B
A sexual health researcher has asked you for some statistical help in interpreting the results of their study. In this study, the researcher randomised 96 people into 4 different education interventions, and measured their knowledge on sexually transmitted infections (STIs) one month later. The knowledge score is measured on a scale from 0 to 25 and the education groups are as follows:
Group A: An email containing links to web resources
Group B: A one on one discussion with a nurse about STIs
Group C: A fact sheet / brochure
Group D: An interactive group presentation
The data are provided in the dataset “knowledge.dta”.
The researcher has previously completed an introductory statistics course, and analysed the scores across groups using the stata code below, where variables B, C, and D represent indicator variables for education groups B, C and D respectively, and ‘score’ represents the knowledge score.
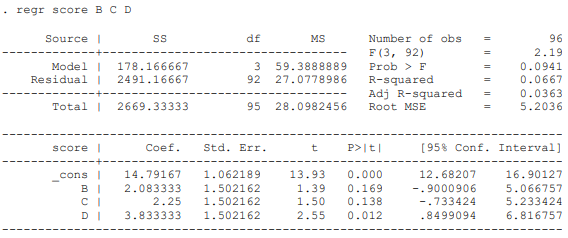
The researcher interprets the results as telling him that the group presentation (D) is definitely the best education intervention because it is the only one with a “significant” p-value. Following this conclusion, the researcher decided to leave the “non-significant” indicator variables out of the regression model and obtained the following results:
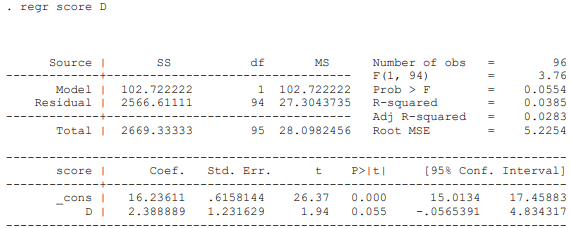
He suggests that this provides the simplest summary result and would like to report this in his research paper. However, he is confused as to why the estimated regression coefficient for group D has reduced compared with the previous model, with the P-value now being greater than 0.05.
Question 1
Provide some advice to the researcher on their interpretation of the data analysis. Do you agree that the second regression results with the indicator for group D alone should be reported? Explain why or why not and provide a detailed explanation as to what the regression coefficient value (for the model with D alone) means. Why has the regression coefficient for group D reduced in the second analysis?
[Note: In this question the focus is on interpretation and so you can assume all assumptions for the regression model hold. NO FURTHER DATA ANALYSIS should be carried out to answer this question]
Question 2
We now ask you to explore the relationship between regression and ANOVA parametrisations for the 4-group comparison. Write down in algebraic notation the regression model with the grouping variable represented as binary indicator variables (as fitted in Question 1), labelling the 4 regression coefficients β0β ,1β ,2 and β3 listed in the same order as the 1st output above. Now consider the reparametrised model using “sum-to-zero” coding, i.e. express the model as Yij + u + ai + Eij with i = 1, 2, 3, 4 and a1+a2+a3+a4 = 0 . Derive algebraic expressions for the a parameters in terms of the B’s by equating the two alternative expressions for the mean of each of the four groups and simplifying.
[Hint: first eliminate a4 from the 4 equations. Your end result should be an expression for each a parameter involving just the B’s.]
Question 3
After much further discussion with the investigator, you determine that he is primarily interested in the following comparisons among the interventions:
(i) Web resources (A) versus all other groups combined together (B, C and D)
(ii) Group presentation (D) compared with the one on one discussion with a nurse (B)
(iii) Passive learning interventions (A and C combined) compared with the more interactive interventions (B and D combined)
Express these contrasts in terms of the β’s using a regression model with binary group indicators, and estimate them using the data and the appropriate Stata command. Are any of these contrasts statistically significant?
Question 4
In question 3, 3 P-values were calculated in Stata - one for each of the comparisons of interest.
(i) Using the Bonferroni method, calculate the adjusted P-value cut-off (a ∗ ) for which Pvalues must be less than so that the Type I error value across all three comparisons is less than 0.05.
(ii) Discuss any benefits or drawbacks of using the Bonferroni method in the context of this question.
Students succeed in their courses by connecting and communicating with an expert until they receive help on their questions

Consult our trusted tutors.


 Login | Sign Up

