Task description
Scenario
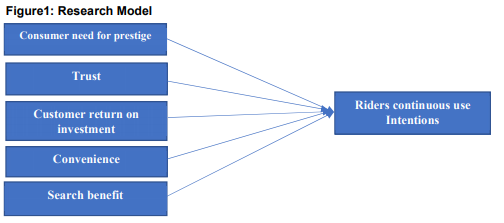
Uber, a ridesharing service company has recently entered the Nepalese market, and its service has been received by some people. Like any product or service, customers’ adoption and usage are essential for the survival of the firm. Thus, like any other services, there might many factors that have influenced riders to adopt and use Uber services. However, from the existing literature, empirical studieson factors determining ridesharing service adoption is scarce, especially in emerging economies. Thus, a study is being conducted to address this gap in the literature. The social exchange theory forms the basis of the study. The researcher designed the research model shown in figure 1 and developed hypotheses H1-H5(see below the research model). Based on the research model shown in figure 1, data was collected from some Uber riders in Nepal. The data is available in Exo (see Week 12 folder).
Hypotheses(H)
H1: Consumer need for prestige has a positive effect on riders’ continuous usage intentions
H2: Trust has a positive effect on riders’ continuous usage intentions
H3: Customer return investment has a positive effect on riders’ continuous usage intentions
H4: Convenience has a positive effect on riders’ continuous usage intentions
H5: Search benefit has a positive effect on riders’ continuous usage intentions
Consumer need for prestige
Riders continuous use
Intentions
Trust
Customer return on
investment
Convenience
Search benefit
Task
1. Clean the data- outliers and missing values
2. Analyse the demographic characteristics of the respondents. Create relevant chats to present your findings.
3. Normality and distribution of data – perform a descriptive analysis (mean and Hy SD of the items) and test normality (skewness and kurtosis for all items)
4. Preliminary analysis- test the following:
a. Reliability (Cronbach alpha and CR)
b. convergent validity (factor loading and AVE).
c. discriminant validity (using correlation and square root of the AVEs)
5. Hypotheses testing: run a multiple regression to test the hypotheses (H1-H5).
6. Interpretation of findings: interpret the results from each of the analyses you have performed (steps 2 to 5)
Students succeed in their courses by connecting and communicating with an expert until they receive help on their questions

Consult our trusted tutors.


 Login | Sign Up

