2. This exercise is based on the arbitrage price theory. Choose a stock (a security) you want to analyze. Do not use Microsoft stocks. Use the Yahoo Finance web site to download the historical data you will need. Once you are at this site:
Choose your stock;
Select ’Historical Price’;
Select 3/1/1986 (March 1986) as a ’Start Date’;
Select 6/1/2020 (June 2020) as an ’End Date’;
Indicate you want to work with monthly data;
After you have specified these parameters, scroll down and click on the ’Download to Spreadsheet’ link. This will allow you to download into a ’Comma-SeparatedValue’ (with the extension csv) file which can be opened with Excel. The data series needed for the assignment would be in the last column under the heading ’Adj Close’ (for ’adjusted closing price,’ where the price at the end of trading is adjusted for dividends and stock splits.
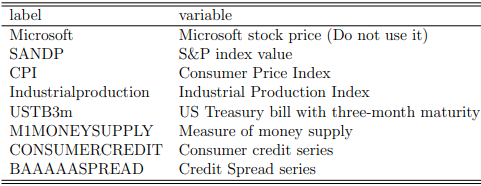
You will examine regressions that seek to determine whether the monthly returns on your stock can be explained by unexpected changes in a set of macroeconomic variables. Open the hw3 q1.csv file that contains the following variables:
(a) By transforming only the CPI into inflation (percentage change), estimate a regression model using your stock as the dependent variable and all the other variables on the right-hand side (RHS). Plot your stock price.
(b) Which explanatory variables in the model appear to have a statistically significant effect on your stock? (Give details, not just a list!)
(c) Choose the best model (best set of RHS variables). Briefly explain the criteria you used.
(d) Do each of the variables appear to be stationary (determine the order of integration of each variable)?
(e) Now create the excess return for your stock and the market risk premium (see class notes). Plot both of them on a graph.
(f) Determine whether the variables are stationary or not. When necessary, transform them into stationary variables using first difference.
(g) Regress the entire set of stationary explanatory variables on excess return of your stock. Which coefficients estimated in the previous question are statistically significant at the 5% level?
(h) Is the regression in (g) ”significant” (overall F-test)?
(i) Choose the best model (best set of explanatory variables).
(j) Which estimation results are correct (i.e. provide valid results), those in (a) & (c) or those in (i)? Explain your answer (i.e. why one set of results are valid but the others are not).
(k) What is the excess return for your stock if the market risk premium is equal to 0.5
and all other explanatory variables are equal to 0?
Students succeed in their courses by connecting and communicating with an expert until they receive help on their questions

Consult our trusted tutors.


 Login | Sign Up

