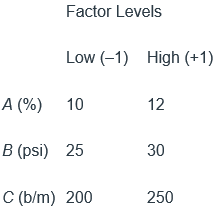
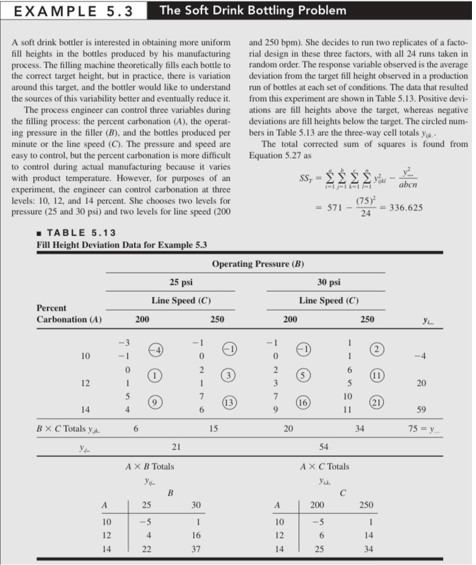
1. Consider a variation of the bottle filling experiment from bottle problem Example (pictures attached). Suppose that only two levels of carbonation are used so that the experiment is a 23 factorial design with two replicates. The data are shown below.

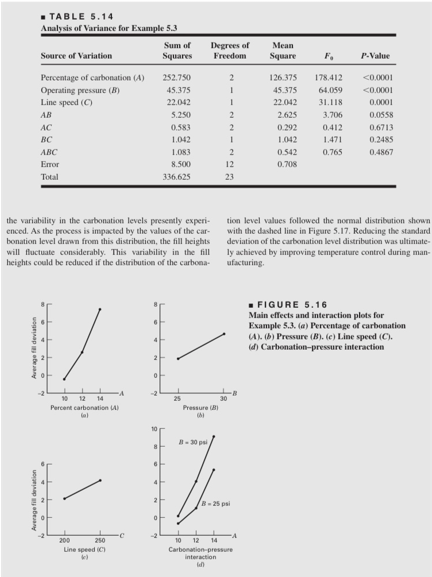
(a) Analyze the data from this experiment. Which factors significantly affect fill height deviation?
(b) Analyze the residuals from this experiment. Are there any indications of model inadequacy?
(c) Obtain a model for predicting fill height deviation in terms of the important process variables. Use this model to construct contour plots to assist in interpreting the results of the experiment.
(d) In part (a), you probably noticed that there was an interaction term that was borderline significant. If you did not include the interaction term in your model, include it now and repeat the analysis. What difference did this make? If you elected to include the interaction term in part (a), remove it and repeat the analysis. What difference does this make?
2. An experiment was conducted on a chemical process that produces a polymer. The four factors studied were temperature (A), catalyst concentration (B), time (C), and pressure (D). Two responses, molecular weight and viscosity, were observed. The design matrix and response data are shown below:
Actual
Run Run Molecular Factor Levels
Number Order A B C D Weight Viscosity Low (–) High (+)
1 18 – – – – 2400 1400 A (°C) 100 120
2 9 + – – – 2410 1500 B (%) 4 8
3 13 – + – – 2315 1520 C (min) 20 30
4 8 + + – – 2510 1630 D (psi) 60 75
5 3 – – + – 2615 1380
6 11 + – + – 2625 1525
7 14 – + + – 2400 1500
8 17 + + + – 2750 1620
9 6 – – – + 2400 1400
10 7 + – – + 2390 1525
11 2 – + – + 2300 1500
12 10 + + – + 2520 1500
13 4 – – + + 2625 1420
14 19 + – + + 2630 1490
15 15 – + + + 2500 1500
16 20 + + + + 2710 1600
17 1 0 0 0 0 2515 1500
18 5 0 0 0 0 2500 1460
19 16 0 0 0 0 2400 1525
20 12 0 0 0 0 2475 1500
(a) Consider only the molecular weight response. Plot the effect estimates on a normal probability scale. What effects appear important?
(b) Use an analysis of variance to confirm the results from part (a). Is there an indication of curvature?
(c) Write down a regression model to predict molecular weight as a function of the important variables.
(d) Analyze the residuals and comment on model adequacy.
Students succeed in their courses by connecting and communicating with an expert until they receive help on their questions

Consult our trusted tutors.


 Login | Sign Up

