Task 2: Analysing Twitter Time Series Data
In this task we will be doing some analytics on real Twitter data. The data is stored in a tab (“\t”) delimited format.
The data is supplied with the assignment at the following locations:
Small version Full version
Task_2/Data/twitter-small.tsv Task_2/Data/twitter.tsv
The data has the following attributes
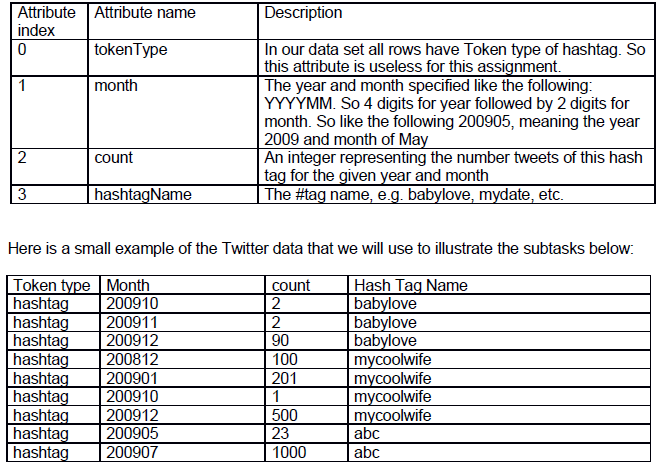
a) [Spark RDD] Find the single row that has the highest count and for that row report the month, count and hashtag name. Print the result to the terminal output using println. So, for the above small example data set the result would be:
month: 200907, count: 1000, hashtagName: abc
b) [Do twice, once using Hive and once using Spark RDD] Find the hash tag name that was tweeted the most in the entire data set across all months. Report the total number of tweets for that hash tag name. You can either print the result to the terminal or output the result to a text file. So, for the above small example data set the output would be:
abc 1023
c) [Spark RDD] Given two months x and y, where y > x, find the hashtag name that has increased the number of tweets the most from month x to month y. Ignore the tweets in the months between x and y, so just compare the number of tweets at month x and at month y. Report the hashtag name, the number of tweets in months x and y. Ignore any hashtag names that had no tweets in either month x or y. You can assume that the combination of hashtag and month is unique. Therefore, the same hashtag and month combination cannot occur more than once. Print the result to the terminal output using println. For the above small example data set:
Input x = 200910, y = 200912
Output hashtagName: mycoolwife, countX: 1, countY: 500
For this subtask you can specify the months x and y as arguments to the script. This is required to test on the full-sized data. For example:
$ bash build_and_run.sh 200901 200902
Students succeed in their courses by connecting and communicating with an expert until they receive help on their questions

Consult our trusted tutors.


 Login | Sign Up

