Part b.
Now, consider the following vector auto regression (VAR), which is potentially of lag-order N, where N is an arbitrary positive integer:
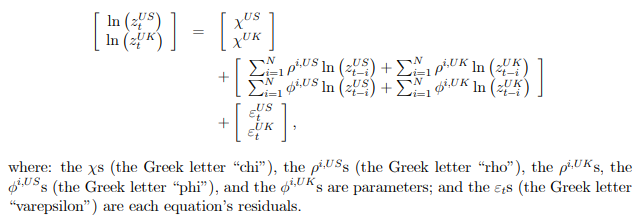
Continue adding code to the provided ExamStataControl.do code to:
1. Quietly run this VAR; (2)
2. Use Statas varsoc command with maxlag option of 10 to decide on the optimal number of lags for this VAR (choose the shortest number of lags suggested by information criteria);
3. Quietly run this VAR again, now using your chosen optimal number of lags, and use Statas vargranger command to decide on variable ordering to make the VAR recursive;
4. Run the VAR in recursive form using your chosen optimal number of lags and predict the residuals associated with each equation (for the U.S. equation call the residuals eUS,and for the U.K. equation call the residuals eUK);
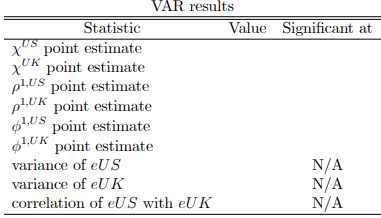
5. Test this last VAR that you run for stability. Then, set up the table below in the Word le you created for part (a) and ll in the missing values (you will need to use Statas corr command and Statas sum command or Statas corr command as well as this command along with the covariance option). For the tables last column, write in x%if a point estimate is significant at the x% level, and write in NSif a point estimate is not significant (this information is not applicable for the last two rows of the table). In addition, in Word le please explain your interpretation of the Granger causality test you ran and what ordering you chose for your VAR given this interpretation. Also, in this Word le explain whether there are spillover effects between U.S. and U.K. productivity or not.
Students succeed in their courses by connecting and communicating with an expert until they receive help on their questions

Consult our trusted tutors.


 Login | Sign Up

