Part 1:
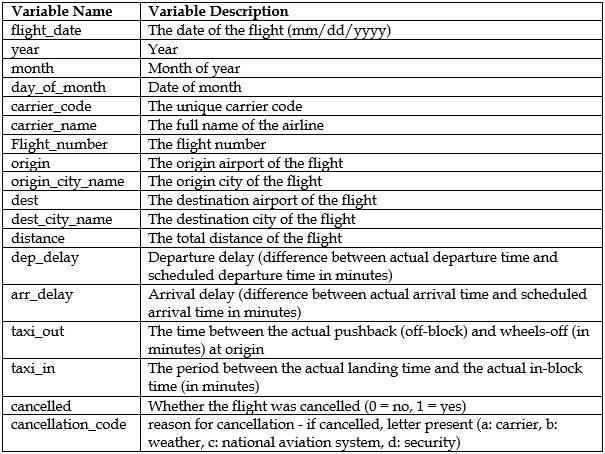
This part of the assignment is based on the dataset "flights.csv". The dataset contains flights information since the outbreak of COVID-19, between 2020-01-01 and 2020-06-30 in US. The metadata for the flights.csv spreadsheet is below:
You need to write codes to generate summary statistics, run them in the R file, and interpret the results. For questions 1 and 2, you need to use base R approach for data retrieving (taught in Module 5). From question 3, including part 2&3, you need to write the codes in the Tidyverse approach. For questions 3-10, the tasks or questions should be completed with one pipeline based on the dataset "flights.csv". No intermediate results should be generated.
Part I: Descriptive analysis using functions
1) Use summary() function to produce the summary statistics of the following variables: dep_delay, arr_delay, taxi_out, taxi_in and distance. Provide one line of code to generate the summary statistics for all the variables. Please use numerical indexing for extracting data in the base R approach to write this code.
2) Use summary() function to produce the summary statistics of two variables: carrier_code and carrier_name. Provide one line of codes to generate the summary statistics for both variables. Please use name indexing for extracting data in the base R approach to write this code, and display top 15 results in the frequency table.
3) Generate the summary statistics of three carriers with names American Airlines, Delta Air Lines and Southwest Airlines. In one pipeline, please generate the summary statistics for all three carriers. Our intention is to compare the summary statistics of the three airlines. For summary statistics, use the provided my_skim() function. (please use the Tidyverse approach; one pipeline only)
4) Using skim() function, write a pipeline of codes to compare the summary statistics of arr_delay and dep_delay for flights that depart from Philadelphia (PHL) and Pittsburgh (PIT). (one pipeline only)
Please answer questions 1-6 in the Answer Sheer based on Q1-Q4. There is no corresponding relationship between the questions number in the answer sheet and the above tasks. You are expected to navigate through the summary statistics generated to find the answers. It is also important for you to get familiar with the statistics generated by the popular descriptive functions.
Students succeed in their courses by connecting and communicating with an expert until they receive help on their questions

Consult our trusted tutors.


 Login | Sign Up

