Assessment Question Week 3:
Markets in Action: Demand and Supply
Question 2
Suppose the graph below represents the demand and supply for cotton wool at various prices, answer the questions that follow.
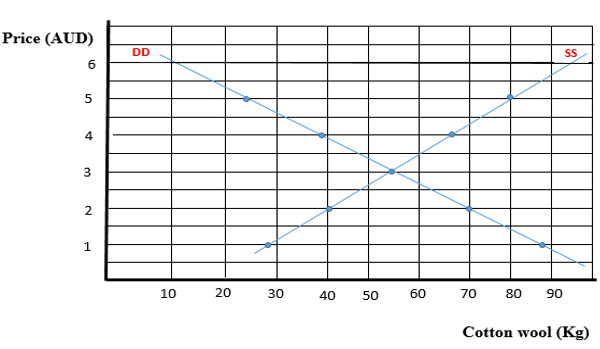
The graph above is represented in the table below. Please complete the table below identifying the shortage or surplus.
|
Price per Kg |
Demand (DD) |
Supply (SS) |
Surplus (+) Shortage (-) |
|
1 |
89 |
29 |
|
|
2 |
70 |
40 |
|
|
3 |
55 |
55 |
|
|
4 |
39 |
67 |
|
|
5 |
25 |
80 |
|
|
6 |
11 |
95 |
|
|
|
|
|
|
A. Based on your findings in the table above, what is the market equilibrium price and quantity for cotton wool?
B. Also, please examine the effects of government legislation on the cotton wool market if the government fixed the price of cotton wool at 2.00?
Students succeed in their courses by connecting and communicating with an expert until they receive help on their questions

Consult our trusted tutors.


 Login | Sign Up

