Question 2.
The diagram below depicts a queue which has a maximum capacity of 4, an arrival rate λ, and can process two individuals at once, each with a service rate µ.
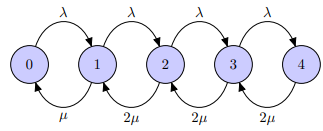
Assume that the queue is in a steady state, let N denote the number of individuals in the queue, and let Pi denote the probability that the queue is in state i, so that Pi = P(N = i).
Using “flow in equals flow out” methods like in Question 4 of Lab 6, complete the following.
(a) Find expressions for P1, P2, P3 and P4 in terms of the traffic intensity ρ = λ/µ and P0.
(b) Hence determine P0 in terms of ρ only.
(c) Complete the remaining entries in the probability mass function table for N:

Give each entry in terms of ρ only.
(d) Determine an expression for L, the long-term average number of individuals in the system, in terms of ρ only.
Hint: how do you usually compute an average from a probability mass function table?
Students succeed in their courses by connecting and communicating with an expert until they receive help on their questions

Consult our trusted tutors.


 Login | Sign Up

