The following parallel boxplot shows the weekly sales figures of three different
Ask Expert

Be Prepared For The Toughest Questions

Practice Problems

The following parallel boxplot shows the weekly sales figures of three different

The following parallel boxplot shows the weekly sales figures of three different mobile phones across a period of six months.


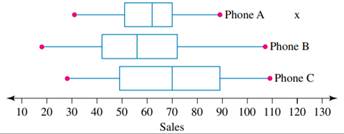
a. Which phone had the highest weekly sales overall?

b. Which phone had the most consistent sales?

c. Which phone had the largest range in sales?

d. Which phone had the largest interquartile range in sales? e. Which phone had the highest median sales figure?

Hint
ManagementInterquartile range (IQR): This interquartile range is the length of the middle 50% of that particular interval of the space. So, if one wants to know if the IQR is in formal terms, then this IQR is calculated as the difference between the third or the upper quartile and the first or the lower quartile....

Know the process

Students succeed in their courses by connecting and communicating with
an expert until they receive help on their questions

1
img

Submit Question

Post project within your desired price and deadline.

2
img

Tutor Is Assigned

A quality expert with the ability to solve your project will be assigned.

3
img

Receive Help

Check order history for updates. An email as a notification will be sent.

img
Unable to find what you’re looking for?

Consult our trusted tutors.

Developed by Versioning Solutions.