Task 3
The quarterly figures for the number of car units manufactured at a factory is shown in the table below. Enter the following data into Excel.
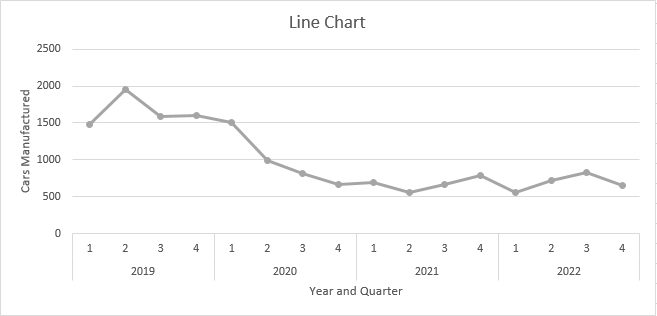
Required (using Excel):
Draw a clearly labelled line graph to represent the cars manufactured
(trendline not required).
Students succeed in their courses by connecting and communicating with an expert until they receive help on their questions

Consult our trusted tutors.


 Login | Sign Up


