Question 4
Use the information on the BMI and Gender of the athletes in the data set AIS.sav to answer the following questions. You should use SPSS to calculate any sample statistics you will need to do this question, but for part (e) you are required to do the rest of the calculations by hand, using a calculator.
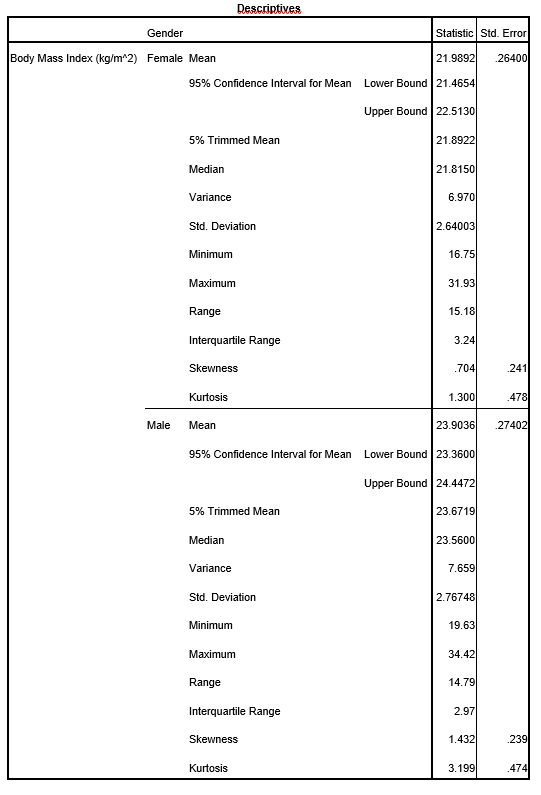
The doctors at AIS wish to check if the mean BMI of the female athletes is lower than that of the male athletes.
(a) Using SPSS produce an appropriate graph to compare the distribution of BMI of the female and male athletes. Label the axes correctly, include unit of measure and provide an appropriate title which includes your name.
(b) Using the graph produced in part (a), briefly describe the distribution of BMI for the two groups of (male and female) athletes. Features discussed should include the shape, centre, spread and outliers, if any.
(c) State appropriate hypotheses (defining all symbols) to answer the question: ‘Is the mean BMI of female athletes is less than that of the male athletes?’
(d) State (but do not check) the assumptions required for the validity of the test. Describe the assumptions in the context of the study.
(e) Without using SPSS, calculate the value of the appropriate test statistic for testing the hypotheses in part (c). [You can use appropriate sample statistics from SPSS output for calculations.]
(f) Using the appropriate statistical table provided in the StudyDesk, find the P-value of the test, and describe the outcome of the test in the context of the study.
(g) Now use SPSS to check your results for the above hypothesis test. Copy and paste the relevant output from SPSS for this test into your assignment.
(h) Briefly comment on how the test statistic and P-value from SPSS output are similar to or differ from your hand calculations.
Students succeed in their courses by connecting and communicating with an expert until they receive help on their questions

Consult our trusted tutors.


 Login | Sign Up