DETAILED INSTRUCTIONS FOR LAB ACTIVITY COMPLETION: This is your lab activity for the course chapter twenty-four (24). Therefore, the first step is to visit the following webpage:
http://phet.colorado.edu/simulations/sims.php?sim=Wave_Interference
The purpose of this webpage is to provide you with the simulation to complete this lab activity.
SECTION ONE (1) –
INSTRUCTIONS FOR COMPLETING SECTION ONE (1):
1. Click on “Run Now” within the simulation. The link to the simulation was provided in the “DETAILED DIRECTIONS FOR LAB ACTIVITY COMPLETION.”
2. Run the simulation.
3. Use the simulation to develop the laboratory report.
DIRECTIONS TO DEVELOP LAB REPORT:
1. For this section, you must write a laboratory report of an experiment to describe a relationship between diffraction and slit width. Use the simulation to conduct your experiment and gather data for this section.
2. Remember to show your calculations where necessary.
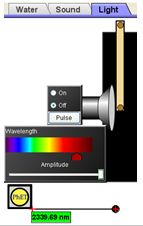
Go to the light tab, and place a mirror vertically in the system so that it forms a barrier that blocks slightly over half the light source (which looks like a speaker. Turn the light source off to clear the screen of residual signal.
In this activity, you may find it useful to use the ruler tool.
The setup is shown to the right.
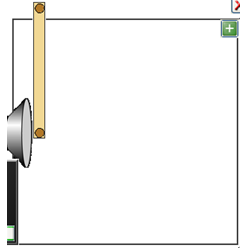
When you turn on the light source using a red wavelength, what do you observe? Draw the region that the light illuminates in the following figure.
Using the measuring tape tool, determine how far the black (non-illuminated) region extends at the top of the box:
When you switch to blue, what area is illuminated? Again draw the region that the light illuminates in the following figure.
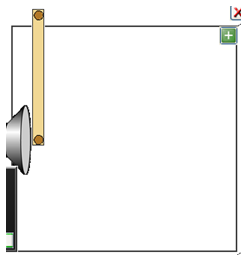
Again using the measuring tape tool, determine how far the black (non-illuminated) region extends at the top of the box:
Which wavelength diffracts more, red or blue?
1) CD basic: Diffraction effects on data clarity.
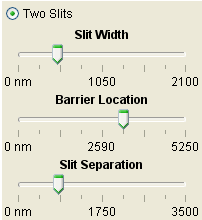
Using the same “wave interference” simulation, remove the mirror by moving it off the region, and add a barrier with two slits. Make the slit width about 525 (on the second mark to the left), make the barrier location 3240 (on the third mark to the right, just to the right of the 2590 mark) and make the slit separation 825 (on the second mark to the left). These settings are shown in the image to the right.
Turn the screen on, and turn the light source on with a blue wavelength. What do you see on the screen (photodiode array)?
What do you see when you switch the signal light to red?
Draw the signal distributions on the screen charts below:
Is diffraction useful in a CD system, or can it lead to data errors? Explain.
A well-aligned optical communication system with high quality optics is said to be diffraction-limited, which means that errors are unlikely EXCEPT for those caused by diffraction, which can’t really be stopped because it is inherent in the wave nature of light.
Which wavelengths are least likely to have data errors in a poorly aligned optical system… long wavelengths (like red) or short wavelengths (like blue)?
2) CD basic: Diffraction effects on “pit” size.
As you’ll see, changing the pit size also changes signal clarity.
Change the slit size to 790, but leave the other variables (slit position and slit separation) the same. Draw your screen results for both red and blue light. Then change your slit width to 260, and do the same. Screen charts are provided for this below.
Which color of light is less likely to have data errors with small data encryption regions (in this case slits… or in the case of actual CDs, which work by reflection, pits)?
What is the advantage of having smaller regions for data encryption on a CD or DVD?
What is a “Blu-Ray” DVD? (If you aren’t sure, look at http://www.blu-ray.com/info/ . )
Can you play a “Blu-Ray DVD” on a first generation DVD player? Explain.
Can you play a DVD designed for original “1st generation” players on a Blu-ray DVD player? Explain.
Students succeed in their courses by connecting and communicating with an expert until they receive help on their questions

Consult our trusted tutors.


 Login | Sign Up

