You are to make several small visualizations using Tableau that will give you an idea of what the capabilities of a professional information visualization package are. The focus of this assignment is the creation of visualization, however, not becoming an expert at Tableau. See our resources page for suggested links to Tableau documentation on how to use Tableau’s main features. Also explore their website for instructional videos and demonstrations. I strongly suggest you begin work on this assignment earlier than usual as it requires gaining expertise with Tableau as well as making the visualizations. When you make your visualizations be sure to add the necessary elements to make them nicely finished presentations. Please be created the exercise visualizations are guides (i.e., include title, annotations, sorting, coloring/highlighting, etc. as you see fit to best communicate your message).
Open Tableau Desktop
While you can use Tableau as a stand-alone tool to access flat files and spreadsheets, the Tableau Server provides:
• A Web Portal – which will allow you to develop the Dashboards and enable others to see and interact with it.
• Published Data Sources – which are IT managed Data Sources.
• Enterprise Services – including access security, scheduling and high availability.
• If you get stuck, consult Tableau’s training resources http://www.tableausoftware.com/learning/training Exercise Objective: Gain hands-on experience with Tableau and become familiar with the interface and tools, practicing various drill-down and filtering techniques to generate insight into data.
• For each question, use the D2L folder/final project with cvs file to create a visualization which will provide the information needed to answer the question. Each question should be on visualization.
• Provide a screen shot of the completed visualization (including any filters) from which you got your answer(s).
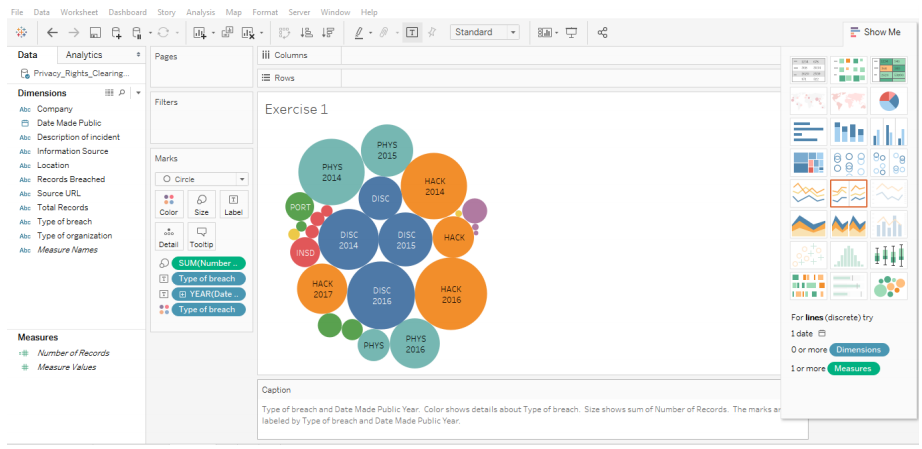
Exercise #1:
Description of "Exercise 1"
Type of breach and Date Made Public Year. Color shows details about Type of breach. Size shows sum of Number of Records. The marks are labeled by Type of breach and Date Made Public Year.
Marks
The mark type is Circle.
The marks are labeled by Type of breach and Date Made Public Year.
Stacked marks is on.
Shelves
Text: Type of breach and Date Made Public Year
Color: Type of breach
Size: Sum of Number of Records
Exercise #2:
Description of "Exercise 2"
Sum of Number of Records for each Type of breach broken down by Date Made Public Year. Color shows details about Type of breach.
Marks
The mark type is Bar.
Stacked marks is on.
Shelves
Rows: Type of breach
Columns: Year of Date Made Public, Number of Records
Color: Type of breach
.PNG)
Exercise #3:
Description of "Exercise 3"
Map based on Longitude (generated) and Latitude (generated). Color shows details about Location. The marks are labeled by Location and Number of Records. Details are shown for Location.
Marks
The mark type is Filled Map.
The marks are labeled by Location and Measure Values.
Stacked marks is off.
Shelves
Rows: Latitude (generated)
Columns: Longitude (generated)
Level of detail: Location
Text: Location and Measure Values
Color: Location
Dimensions
Location has 435 members on this sheet
Members: , District of Columbia; Columbia, South Carolina; Detroit, Michigan; Fairfax, Virginia; Hartford, Connecticut; ...
.PNG)
.PNG)
Exercise #4:
Dashboard Set-up


 Login | Sign Up

