Overview
In this task, you will learn how to draw dependency diagram and normalize a given database.
Tasks to do
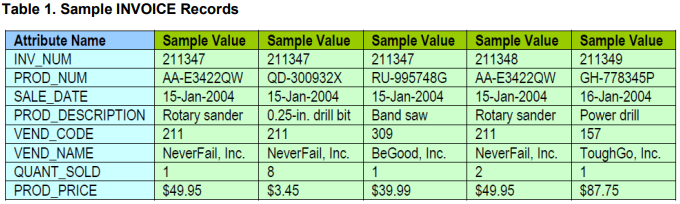
1. Using the INVOICE table structure shown in Table 1 (note that in this table rows are attributes and columns are data records), draw its dependency diagram and identifyall dependencies (including all partial and transitive dependencies). You can see that an invoice has more than one product and a product is in more than one invoice. From the business rules, we know that a product is supplied by one vendor only, but a vendor can supply many products.
Note that you fist need to determine the Primary Key to identify partial and transitive dependencies. What do you think can be the Primary Key in this table? Note that it is a minimal candidate key that can uniquely identify every records.
Table 1. Sample INVOICE Records
You can draw Dependency Diagram using any tool you such as Word or Powerpoint. See Class slides for examples. You can find how to draw Dependency Diagram using Lucid Chart and Powerpoint in the following video.
https://video.deakin.edu.au/media/t/1_diuebsth
2. Using the initial dependency diagram drawn for Question 1, remove all partial dependencies and draw dependency diagrams of new table structures. Note that your actions may result in multiple tables.
3. Using the tables structures you created for Question 2, remove transitive dependencies in all tables and draw dependency diagrams of all tables.
4. Your might have multiple tables by now. For each table, please check if they satisfy conditions for 1NF, 2NF, and 3NF and justify why they do or do not satisfy.
5. Using the table structures from Question 3, draw a complete Entity Relationship Diagram (ERD) of the database using Crow Foot notations in your choice of professional tool (Visio, Lucidchat or draw.io).
NOTE: Because the dependency diagrams cannot show the nature (1:1, 1:M,M:N) of the relationships, the
ERD remains crucial to the design effort. Complex design is impossible to produce successfully without
some form of modelling such as ERD. Yet, as the preceding decompositions demonstrate, the dependency
diagrams are a valuable addition to the designer's toolbox. Normalization is likely to add tables/entities that
may not have been considered during the initial (conceptual) modelling process. Therefore, initial ERD may
change after normalization.
Students succeed in their courses by connecting and communicating with an expert until they receive help on their questions

Consult our trusted tutors.


 Login | Sign Up

