Q3 D3 (v5) Warmup
Read chapters 4-8 of Scott Murray’s Interactive Data Visualization for the Web, 2nd edition (sign in using your GT account, e.g., jdoe3@gatech.edu). You may also briefly review chapters 1-3 if you need additional background on web development. This simple reading provides important foundation you will need for Homework 2. This question uses D3 version v5, while the book covers D3 v4. What you learn from the book is transferable to v5. In Homework 2, you will work with D3 extensively.
NOTE the following important points:
1. We highly recommend that you use the latest Chrome browser to complete this question. We will grade your work using Chrome 86.0 (or newer).
2. For this homework, the D3 library is provided to you in the lib folder. You must NOT use any D3 libraries (d3*.js) other than the ones provided. In Gradescope, these libraries will be provided for you in the autograding environment.
3. You will need to setup an HTTP server to run your D3 visualizations as discussed in the D3 lecture (OMS students: the video “Week 5 - Data Visualization for the Web (D3) - Prerequisites: JavaScript and SVG”. Campus students: see lecture PDF.). The easiest way is to use http.server for Python 3.x. Run your local HTTP server in the hw1-skeleton/Q3 folder.
4. We have provided sections of code along with comments in the skeleton to help you complete the implementation. While you do not need to remove them, you may need to write additional code to make things work.
5. All d3*.js files in the lib folder are referenced using relative paths in your html file. For example, since the file “Q3/submission.html” uses d3, its header contains:
<script type="text/javascript" src="lib/d3/d3.min.js"></script>
It is incorrect to use an absolute path such as:
<script type="text/javascript" src="http://d3js.org/d3.v5.min.js"></script>
The 3 files that are referenced are:
- lib/d3/d3.min.js
- lib/d3-dsv/d3-dsv.min.js
- lib/d3-fetch/d3-fetch.min.js
6. In your html / js code, use a relative path to read in the dataset file. For example, since Q3 requires reading data from the q3.csv file, the path should be ‘q3.csv’ and NOT an absolute path such as “C:/Users/polo/HW1- skeleton/Q3/q3.csv”. Absolute/local paths are specific locations that exist only on your computer, which means your code will NOT run on our machines when we grade (and you will lose points). Gradescope will provide a copy of the q3.csv dataset using the same directory structure provided in the HW skeleton.
7. Load the data from q3.csv using D3 fetch methods. We recommend d3.dsv(). Handle any data conversions that might be needed, e.g., strings that need to be converted to integer. See https://github.com/d3/d3-fetch#dsv
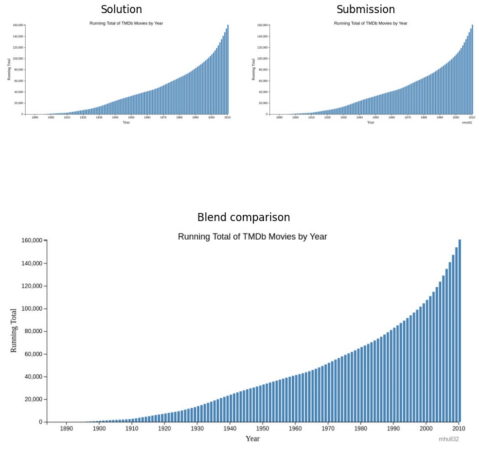
submission.html : when run in a browser, it should display a vertical barplot with the following specifications:
a. The barplot must display one bar per row in the q3.csv dataset. Each bar corresponds to the running total of movies for a given year. The height of each bar represents the running total. The bars are ordered by ascending time with the earliest observation at the far left. i.e., 1880, 1890, ..., 2000
b. The bars must have the same fixed width, and there must be some space between two bars, so that the bars do not overlap.
c. The plot must have visible X and Y axes that scale according to the generated bars. That
is, the axes are driven by the data that they are representing. Likewise, the ticks on these axes
must adjust automatically based on the values within the datasets, i.e., they must not be hard-coded.
The x-axis must be a

Deliverables : Submit the following file to Gradescope:
1. submission.html: Modified file containing all html, javascript, and any css code required to produce the barplot. Do not include the D3 libraries or q3.csv dataset.
Students succeed in their courses by connecting and communicating with an expert until they receive help on their questions

Consult our trusted tutors.


 Login | Sign Up

