Description and goal
Your goal is to provide a data analysis within the context of a business application.
Objectives: This problem set reinforces foundational dashboarding concepts. Students use the data set FLCRASH to investigate road incidents in Florida between 2008 and 2010. In this problem set students will have the opportunity to practice skills such as:
• Enhance dashboards through clear labels and titles
• Create numerous visualizations to demonstrate patterns
• Utilize advanced analytics to extract insights
• Add interactions for user-friendliness and dashboard customization
• Present the key findings during a max. 15minutes oral presentation
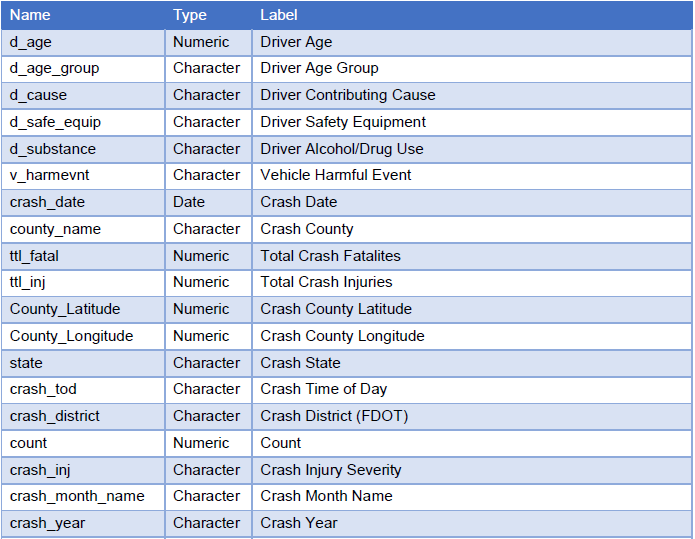
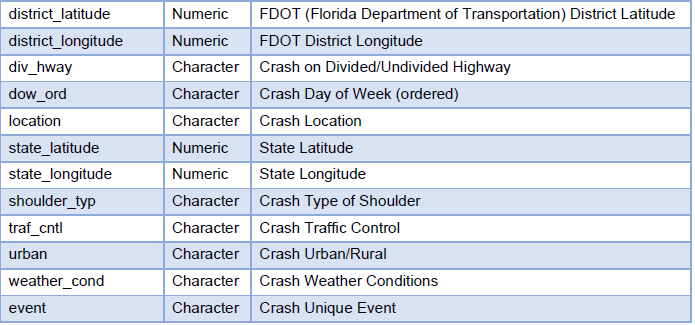
Crash data set – data exploration and analysis
The data set FLCRASH contains detailed records of road incidents that happened in Florida between 2008 and 2010. A road safety officer asks you to perform the following tasks:
1. Using SAS Visual Analytics, your goal as an analyst is to design an interactive dashboard to explore and visualize the data.
2. In addition, you must extract one interesting insight by investigating relationships between some key variables, by using clustering, linear regression, forecasting or decision trees (i.e., a method covered in the lectures).
Submit a presentation of max. 15 minutes where:
• you explain your dashboard and present your key findings to the road safety officer, and
• explain and interpret the model you’ve used to extract one interesting insight.
This question is open: it is up to you to decide
• what to show in the dashboard and how show it;
• what is an interesting insight;
• and which relationships between which variables you want to investigate.
Note: “when it rains, the road is slippery.” is not an interesting insight. However, “there’s an increase in car accidents in the month of July, because…” would be an interesting insight.
The oral presentation can either be:
• a recording using a PowerPoint deck/presentation, or
• a recording using the dashboard itself.
Students succeed in their courses by connecting and communicating with an expert until they receive help on their questions

Consult our trusted tutors.


 Login | Sign Up

