Context
In this practical assignment, students will apply their business intelligence knowledge and practical skills to development business intelligence solution.
This practical assignment setting will be on cybersecurity dashboard. As an analyst, your main task is to apply MS Power BI tool and develop business intelligence solution (i.e., cybersecurity dashboards). You may use either real-world or artificial dataset.
Specific Requirements
1. Your task is to develop the relevant BI dashboards using MS Power BI tool. Please present the BI dashboard first, then followed by the explanation of each individual chart of the dashboard. At least 3 different dashboards are expected.
2. Justify why these BI solutions could provide insights and why those attributes are laid out in the fashion you proposed (feel free to include all other relevant justifications). Note: To ensure that you discuss task (2) properly, you must include visual samples of the reports you produce (i.e. the screenshots of the BI charts/dashboards must be presented and explained in the written report; use ‘Snipping tool’), and also include any assumptions that you may have made.
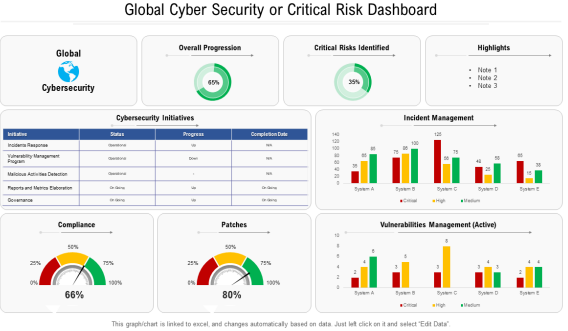
3. The BI report should include: 1) objectives and advantages of your BI solution, 2) BI dashboards screenshots and commentary, 3) overall findings and recommendations based on your analysis, etc. Feel free to make reasonable assumptions or refine the data as needed. You may create your own artificial datasets. Real-world dataset is not mandatory. Note: Do refer to assignment marking rubric & report outline example. See examples of cybersecurity dashboard: https://www.slideteam.net/blog/cybersecurity-dashboard-templates-ppt-presentation
4. Some useful links:
• https://github.com/shramos/Awesome-Cybersecurity-Datasets
• https://analyticsindiamag.com/top-10-datasets-for-cybersecurity-projects/
• https://www.kaggle.com/general/127234
• https://data.world/datasets/cybersecurity
• https://csr.lanl.gov/data/
• http://rissgroup.org/ransomware-dataset/
• https://www.unb.ca/cic/datasets/index.html
• https://ensarseker1.medium.com/cybersecurity-projects-for-beginners-with-open-datasetsabcd8beb8a1c
NOTE:
• You must produce the actual dashboard visuals in MS Power BI tool.
• You must include a screenshot of your ‘Certificate of Completion for Power BI Essential’ and your dataset structure as appendix within the assignment report (i.e., screenshot of all your dataset columns and first 5 sample tuples/rows)
• If you think the best presentation/visualization, is to use, say, a pie chart, then discuss using a pie chart and indicate what the pie chart would show, what are the benefits of using pie chart, and discuss the chart’s findings/insights in your commentary.
• At least 3 dashboards are expected, e.g., you may create one dashboard for CISO; one for
CEO; one for Cybersecurity Industry Association
Students succeed in their courses by connecting and communicating with an expert until they receive help on their questions

Consult our trusted tutors.


 Login | Sign Up

