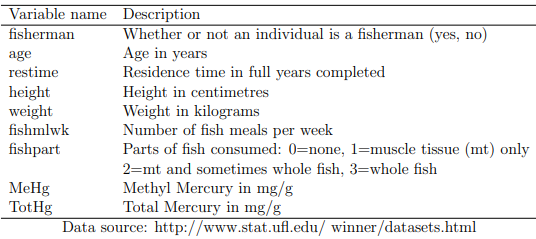
1. A study was conducted on the factors affecting the levels of mercury in hair of fishermen in Kuwait and was reported in an article in the Environmental Pollution journal (Al-Majed and Preston, 2000, pages 239-250). Total and methyl mercury (MeHg) levels were measured from hair samples of 100 randomly selected fishermen and an additional 35 randomly selected workers in a local construction company. All 135 individuals lived in Doha fishing village at the time of the study. The main aim of the study was to determine whether mercury levels were associated with one or more of a number of other variables. The following information was collected from each individual in the sample, some of the numbers were rounded:
Download the dataset from the file fishermen.xlsx on Blackboard. Use the data to answer the following questions.
(a) Look at the dataset and the variable descriptions given above. For each variable, classify it as Num. Continuous, Num. Discrete, Cat. Ordinal or Cat. Nominal.
(b) Using Excel, calculate the mean, standard deviation, median, lower quartile, upper quartile and IQR for the variable weight. Give your answers to one decimal place. Briefly explain what each of the LQ, UQ and IQR tell us about the weights of those surveyed.
(c) Calculate the 90th percentile for the variable weight. What does this number tell you about the weights of the survey respondents?
(d) Create a histogram for the variable TotHg. Use 10 bins (class intervals) and format the horizontal axis to 2 decimal places. How many individuals are in the highest class interval for TotHg? Comment on the main features of the histogram.
(e) Based on your histogram in part (1d) above, would the mean be an appropriate measure of central location for total mercury? If not, state an appropriate alternative and justify your answer briefly.
(f) The relationship between whether or not an individual is a fisherman (fisherman) and parts of fish consumed (fishpart) is to be summarised graphically. Using the PivotChart function in Excel, create a clustered bar chart of these two variables. Use fishpart as the column variable (the ‘legend’) and fisherman as the row variable (horizontal ‘axis’). You can put either variable in the Σ Values field but ensure that you are displaying Count of the variable (not Sum). Show percentages of row total on the vertical axis. Does your graph suggest an association between the variables? Justify your answer.
(g) Create a pivot table for the variables fishpart and fisherman and use it to answer the following questions. You do not need to include the table in your answer script.
i. Of those who are fishermen, what percentage consume ‘muscle tissue and sometimes whole fish’?
ii. Of those who are not fishermen, what percentage consume ‘muscle tissue and sometimes whole fish’?
iii. Of those who consume muscle tissue only, what percentage are fishermen?
iv. What percentage of the sample consume muscle tissue only and are not fishermen?
v. What percentage of the sample consume muscle tissue only or are not fishermen?
vi. If there were no association between the variables, give an example of what you might see in the percentages or proportions you can find using the table.
(h) The relationship between whether or not an individual is a fisherman (fisherman) and methyl mercury (MeHg) is to be summarised graphically. Choose and construct a suitable graphical summary for this purpose. Comment on the main features of your graph. Also, state whether you believe an association between the variables is suggested, briefly justifying your answer. HINT: In a question of this type, we would be looking for a difference in the distribution of the fishers and the nonfishers to suggest an association, in particular a difference between the means.
(i) Create a suitable graphical summary for the relationship between age and TotHg. Why is this graphical summary appropriate for these variables?
Students succeed in their courses by connecting and communicating with an expert until they receive help on their questions

Consult our trusted tutors.


 Login | Sign Up

