3. For the three graphs below, briefly explain how each one could be misleading and a way that it could be improved.
(a) 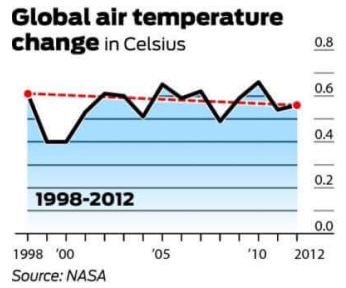
(b) 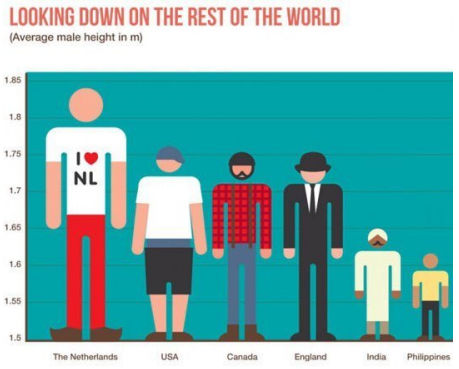
(c) 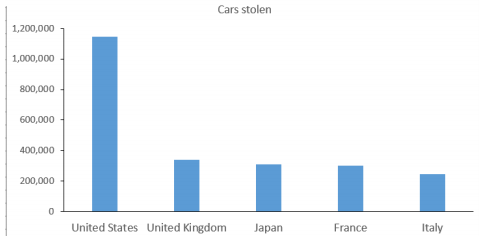
Students succeed in their courses by connecting and communicating with an expert until they receive help on their questions

Consult our trusted tutors.


 Login | Sign Up

