Activity times in days are indicated by the figure that appears under each activity
Ask Expert

Be Prepared For The Toughest Questions

Practice Problems

Activity times in days are indicated by the figure that appears under each activity

PART B:

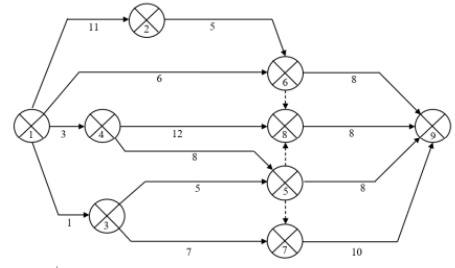
The Activity on Arrow diagram for a project is shown below. Activity times in days are indicated by the figure that appears under each activity. Numbers inside the circles represent the node numbers.


TASKS:

(i) Redraw the above network using the Activity on Node (AON) approach.

(ii) Calculate ES, LS, EF, LF and TF and IF for each activity.

(iii) Identify the critical path for the project.

(iv) Use MS Project to develop the Gantt chart

Make sure you properly show all the dependencies and activity durations.

Hint
Managementi) According to Management, approaches are methods that are utilized to direct and control an association. These might be embraced by an association or a singular director as a component of their style. Coming up next are normal instances of the executives draws near....

Know the process

Students succeed in their courses by connecting and communicating with
an expert until they receive help on their questions

1
img

Submit Question

Post project within your desired price and deadline.

2
img

Tutor Is Assigned

A quality expert with the ability to solve your project will be assigned.

3
img

Receive Help

Check order history for updates. An email as a notification will be sent.

img
Unable to find what you’re looking for?

Consult our trusted tutors.

Developed by Versioning Solutions.