Assignment # 2
Misleading Graphs
Can inaccurate graphs bias the interpretation of data? Graphs provide a visual representation of data meant to provide information. Here are three graphs that may present data in an inaccurate or misleading manner. Choose one graph for this discussion and answer the questions based on your chosen graph.
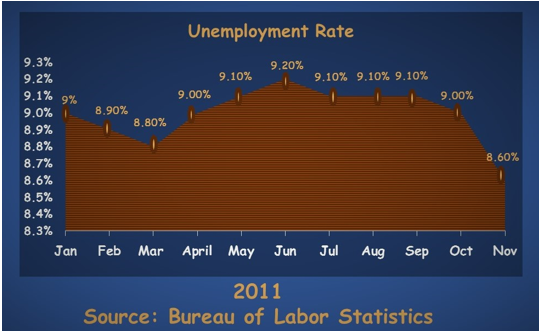
Graph 1 was used to display changes in the Unemployment Rate over 12 months
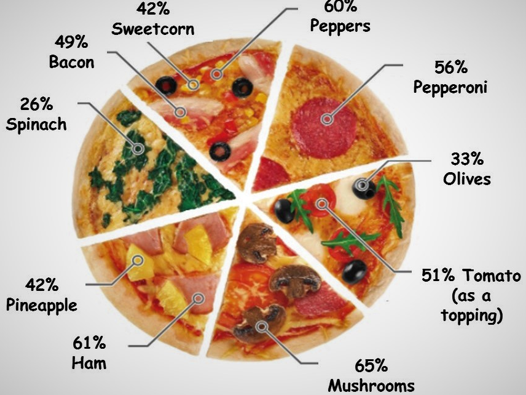
Graph 2 was used to display pizza topping preferences based on a survey of people living in the United Kingdom
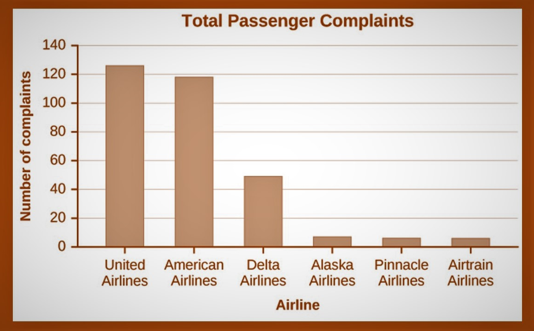
Graph 3 was used to display the number of complaints reported for six different airlines per the US Department of Transportation in February 2013.
Instructions
For this discussion, you are to choose one graph, and complete these steps based on the graph you chose:
Steps
• State the graph you chose:
• Discuss how you interpreted the graph when you first saw it.
o What did it tell you about the data represented?
o Did you find it confusing?
• Now, study the graph. Use your understanding of the topics Graphs, Pie Charts, and Bar Charts to interpret what is being presented.
• Compare your first impression with your second more informed interpretation and answer the following:
o Is the information presented in a biased way (that is, is it misleading?)
o What information is being misinterpreted here? How?
o What type of graph was used and was it used correctly?
o How could you correct the graph so that it more accurately represents the data?
• Discuss why someone might intentionally use a graph to mislead?
Please be sure to validate your opinions and ideas with citations and references in APA format.
Students succeed in their courses by connecting and communicating with an expert until they receive help on their questions

Consult our trusted tutors.


 Login | Sign Up

