Complete the histogram, the frequency polygon and the less than cumulative ogive below
Ask Expert

Be Prepared For The Toughest Questions

Practice Problems

Complete the histogram, the frequency polygon and the less than cumulative ogive below

Complete the following frequency distribution and graphs.

Grouped Data Frequency Distribution


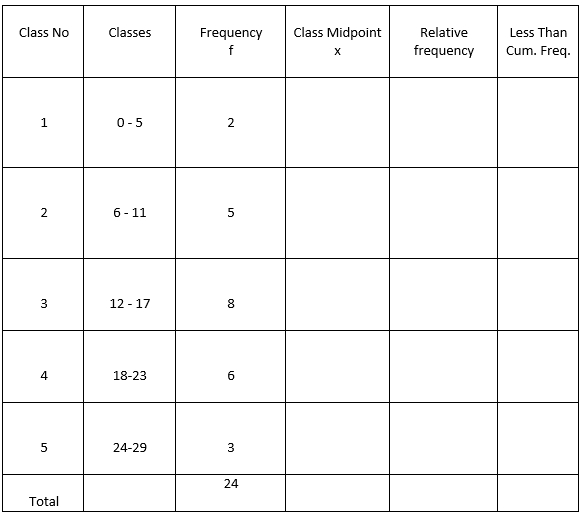
Complete the histogram, the frequency polygon and the less than cumulative ogive below.  Use the Insert – chart Tab.  Then use the column graph for the histogram, the line graph for the polygon and the ogive.  Make sure that you first decrease the text boxes for the data to only two columns.  Then insert the midpoints and the frequencies from the chart above for the histogram and the polygon, and then insert the upper class boundaries and the cumulative frequencies for the ogive.

Hint
Statistics A histogram refers to a bar graph-like representation of data that buckets a range of outcomes into columns along the x-axis. The y-axis represents the number of counts or the percentage of occurrences in the data for each column and is used to visualize data distributions....

Know the process

Students succeed in their courses by connecting and communicating with
an expert until they receive help on their questions

1
img

Submit Question

Post project within your desired price and deadline.

2
img

Tutor Is Assigned

A quality expert with the ability to solve your project will be assigned.

3
img

Receive Help

Check order history for updates. An email as a notification will be sent.

img
Unable to find what you’re looking for?

Consult our trusted tutors.

Developed by Versioning Solutions.