Assessed Exercise (Week 7)
"Applying descriptive statistics"
For this assessment you will be using data captured during the Week 6 workshops. As you are aware, all students participated in an online survey, resulting in a large amount of both qualitative and quantitative data.
We have selected a sub-set of this data for you to download from the Moodle as an anonymized CSV.
Complete the following:
1. Select a single metric from the data (e.g. age)
2. Design a MATLAB script to compute the population standard deviation and the Interquartile Range of this metric. Annotate each line of your script to describe what it does and the result it produces.
3. Imagine that this data is a sample of a wider population (e.g. all students at Monash). Create a script to compute the sample standard deviation. Annotate each line of your script to describe what it does and the result it produces
4. Select an numeric scale metric from the data, and use MATLAB to produce a boxplot of this metric and label this properly. Annotate your boxplot using MATLAB to indicate what each element means.
Annotate each line of your script to describe what it does.
Assessed Exercise (Week 8)
"Working with hypotheses"
In this exercise you will formulate a hypothesis, prepare a plan of your study (including statistical testing) and justify it, including the potential limitations of it. Consider the topic of the survey that you participated in during the unit, and used for the Week 7 assessment task. Imagine you are asked to develop this research area further.
Complete the following:
1. Propose a hypothesis. It should be something you can realistically test using one or more of the statistical tests covered in this course. It can concern any topic or natural phenomena which relates in some way to the survey topic.
2. Write down the null hypothesis.
3. Write down the independent and dependent variables as well as at least three confounding variables.
4. Imagine you had a budget of up to 1000AUD (in addition to up to 100 hours of your time to conduct the study). Explain what data you will collect to investigate this hypothesis and how you would obtain the data in a practical fashion.
5. What statistical tests do you expect to conduct to test the hypothesis. Please explain the circumstances in which you would conduct each test.
6. What are the limitations of your study? Write a paragraph that explains these limitations as well as potential future investigations you might conduct.
Assessed Exercise (Week 9)
"Evaluating machine learning algorithms"
The local Council are considering purchasing a waste sorting system, for the purposes of recycling. This takes a photograph of each object in turn, before applying a computer vision algorithm to sort each object into the relevant category. The machine is capable of sorting into the following categories: plastic bottles (B), tin cans (T), glass jars (J) and everything else (X). To measure the performance of the waste sorting system, the council tested the system with a sample of 30 items, which were in turn sorted by the machine and given a Label.
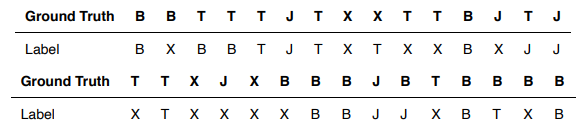
By hand (on paper or in a digital document) and showing your working:
1. Compute the Confusion Matrix for the Machine, based upon the sample above
2. Using the Confusion Matrix, or otherwise, compute the Accuracy of the waste sorting system, based on the sample above.
3. The Council is considering using the Accuracy figure based on the sample as a means for deciding if it should purchase the waste sorting system. Explain why this might not be appropriate.
4. The Council considers that they will use the system purely as a machine for identifying and extracting plastic bottles (and which will reject everything else). On that basis, compute the Precision, Recall and F1-Score using the Confusion Matrix, or otherwise.
Students succeed in their courses by connecting and communicating with an expert until they receive help on their questions

Consult our trusted tutors.


 Login | Sign Up

