QUESTION B2: Distribution of the Spread of COVID-19 in Australia and its Eight States/Territories
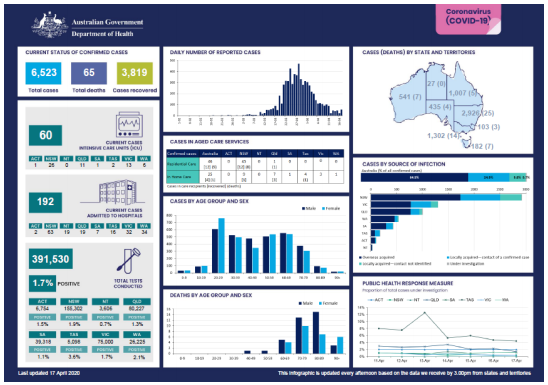
a. The diagram below, also saved as COVIDAustralia.pdf, presents several graphical presentations about the status of the COVID-19 pandemic over time, by states, by gender and by age group in Australia. Based on these plots, present an analysis of the distribution of the number of COVID-19 cases in Australia. You can cut and paste any of the graphs in your discussion.
b. The article ‘Charting the COVID-19 spread in Australia’ in the website below presents detailed analysis of the distribution of the Coronavirus pandemic across the Australian states. It also places Australia in the world picture showing its trend compared to other countries. Present a report of the current status in Australia as a whole and also the rate of infection compared to other countries. Using all the state-wide information and graphs presented in the website report, https://www.abc.net.au/news/2020-03-17/coronavirus-casesdata-reveals-how-covid-19-spreads-in-australia/12060704, present a detailed comparison of the COVID-19 pandemic across the 8 Australian states and territories.
Students succeed in their courses by connecting and communicating with an expert until they receive help on their questions

Consult our trusted tutors.


 Login | Sign Up

