Hypothesis testing
1. Explain the difference between null hypothesis and alternative hypothesis. Provide an example of a research question and the two types of hypotheses. Null and alternative hypotheses are both used in statistical hypothesis testing. The null hypothesis of a test always predicts no effect or no relationship between the variables. On the other hand, the alternative hypothesis states your research prediction of an effect or relationship. Null Hypothesis: On the average, the dosage sold under this brand is 50 mg(population mean dosage=50 mg). Alternative Hypothesis: On the average, the dosage sold under this brand is not 50 mg (population mean dosage does not equal to 50 mg).
2. What is the purpose of hypothesis testing in research and evidence-based practice? Provide an example of the application of hypothesis testing in evidence-based practice. Hypothesis testing is the process used to evaluate the strength of evidence from the sample and provide a framework for making determinations related to the population. An example of hypothesis testing would be null hypothesis- children who take vitamin C are no less likely to become ill during flu season. The alternative hypothesis would be children who take vitamin C are less likely to become ill during flu season.
3. What does the p-value mean? Is this an established benchmark used or an arbitrary number identified by researchers? The p-value, or the probability value is a number describing how likely it is that your data would have occurred by random chance (testing if the null hypothesis is true). Despite the general acceptance of the 0.05 cut-off for statistical significance, the p-value is ultimately an arbitrary value that has no more or less real-life importance than 0.049 or 0.051. Although as a community, science has operated with the perception that a p-value can add a sense of certainty to a finding.
4. A researcher designs a cohort study to estimate the risk of 30-day readmission after knee arthroplasty in Puerto Rico. She wants to find out if patients who received spinal anesthesia have lower risk of readmission compared to patients who received general/other anesthesia. Patients were followed 30 days after surgery to determine readmission. The researcher identified 78 patients who met the inclusion criteria for the study and followed them. She found a Relative Risk of 0.65 [0.51-0.81] comparing those with spinal anesthesia to those with general/other.
a. Identify and explain your reasoning for the following concepts:
i. Research Question
ii. Independent variable and level of measurement
iii. Dependent variable and level of measurement
iv. Possible confounding variable
v. Null hypothesis
vi. Alternative Hypothesis
vii. Effect Size (explain how the researcher calculated the effect size)
b. What could be another method to calculate the effect size in this study?
c. What are the established levels of effect sizes mentioned in the textbook?
d. Based on the level of measurements identified for the independent and dependent variables, what would be the recommended statistical test?
e. Explain what represents the type I and type II error in this example. Apply the errors to the practical exercise using the variables identified.
5. True or False: obtaining a statistically significant p-value (i.e., p< a prespecified level such as .05) is enough to conclude that there is a meaningful effect.
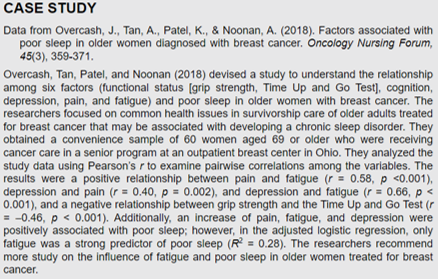
6. Identified what indicators are used and interpret them in the case study presented in page 152.
7. Explain Pearson’s (r) correlation coefficient
8. What is the difference between Pearson’s and Spearmans’ Rho?
9. Covariance is a measure of relationships, but it is treated as a crude measure of relationships when compared with correlation. Why is this?
10. What are the components of the linear regression equation? Explain each variable in the equation.
11. Mention the assumptions for a linear regression model.
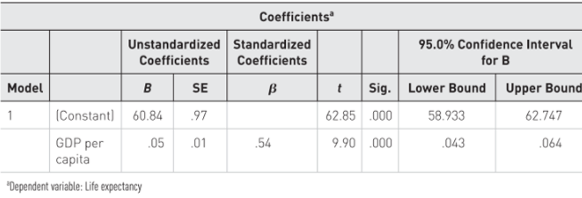
12. In the table presented in the textbook, what does the “sig” column mean? Interpret the confidence intervals for the estimate of “60.84”.
13. What is the difference between Linear regression and multiple linear regression?
14. When is a logistic regression the best choice for modeling associations? What are the model parameters and assumptions?
Students succeed in their courses by connecting and communicating with an expert until they receive help on their questions

Consult our trusted tutors.


 Login | Sign Up

