1. If a mew of 20 on a depression symptom scale represents a depressed population, and I want to test if my treated sample of depressed people with a M of 15 on the depression symptom scale still represents the depressed population, how do I state the null and alternate hypotheses?
2. Which hypothesis do we hope to find support for?
3. Describe what it means—in terms of the alternate hypothesis, if your sample mean does not end up in the critical region of the null distribution?
4. If the alpha level is .05, what is the size of the critical region?
5. Regarding Type II error and the critical region, what does it mean if we change alpha from .05 to .01? (please read this question carefully)
6. A researcher conducts a hypothesis test and finds that the sample mean is in the critical region of the null distribution. So the researcher rejects the null hypothesis. But in fact the sample mean is actually an outlier in the null distribution. What type of error has the researcher made?
7. Can the researcher find out if she has actually made a Type 1 or Type 2 Error, and can she “go back and fix it?” Explain why or why not.
8. If I “set” alpha at .05, and I have a two tailed test, how much area goes in each tail?
9. The below graph represents a null distribution, with the dark cutoff line representing Z = 1.96. Using the insert line function draw a pointer showing which side of the line you need to be on to reject the null hypothesis.
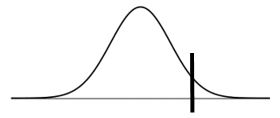
Want it to be beyond cutoff (in critical region)
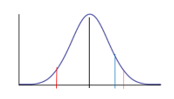
10. This is a normal curve. The line in red represents the critical cutoff for 2 standard errors from the null mean. The blue line represents the Z score that represents the sample mean in the hypothesis test. Do you reject the null hypothesis or not? State what the blue line means about the relationship between the sample mean and the null distribution mean at the center of the graph—with respect to rejecting a hypothesis or not.
11. We set the cutoff for rejecting the null at p <= .05. The probability that our sample value is in the null distribution is .03. Can we reject the null? Why or why not?
12. How does sample size influence significance? What happens to significance if the sample is smaller or larger? Through what part of the formula does the sample size influence the significance test?
13. What is the denominator for a significance test, what is the denominator for Cohen’s d, and how are they different?
14. Suppose Cohen’s D is .5. What does this actually tell me about the difference between two means?
15. Suppose I calculate the Cohen’s d for the difference between 2 means and find that it is very small—that is, the two means are very close together. Do I know if the 2 means are not significantly different?
16. A manufacturer claims that a diet pill helps people lose 5 pounds a week, with a standard deviation of 8 pounds. The consumer group believes weight loss will be different. They collect data from 81 people and find weight loss is 2 pound a week. Test the hypothesis that weight loss is less than the claimed value of 5 pounds a week.
a. Is this a directional test? Why or why not?
b. What is the null hypothesis
c. What is the alternate hypothesis
d. What is the standard error?
e. What Z score do you get from your calculations, to represent the sample mean?
f. Assuming that the Z score cutoff is -1.96, can you reject the null hypothesis? (if you are uncertain you may find it helpful to draw the graph and show where the cutoff Z score and where your sample mean Z score are.
g. What is the effect size for the difference between the two means using Cohen’s d and what does it mean?
Students succeed in their courses by connecting and communicating with an expert until they receive help on their questions

Consult our trusted tutors.


 Login | Sign Up

