1. Nonparametric Log-Log Based Confidence Interval for S(t). In a study, the failure times of n subjects (from the same population) are observed subject to right censoring. Let a1 < a2..... <ak denote the distinct failure times recorded in the study. We have derived ^S(t), the Kaplan-Meier estimate for the survival function S(t) of the underlying failure time distribution, and the Greenwood's formula for estimating the variance of ^S(t). Show that
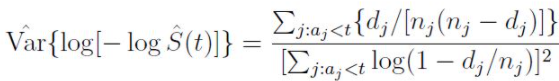
where dj is the number of failures at time aj and nj is the number of subjects at risk at aj. Also describe how you will obtain the log-log based (point-wise) confidence interval for S(t).
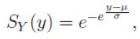
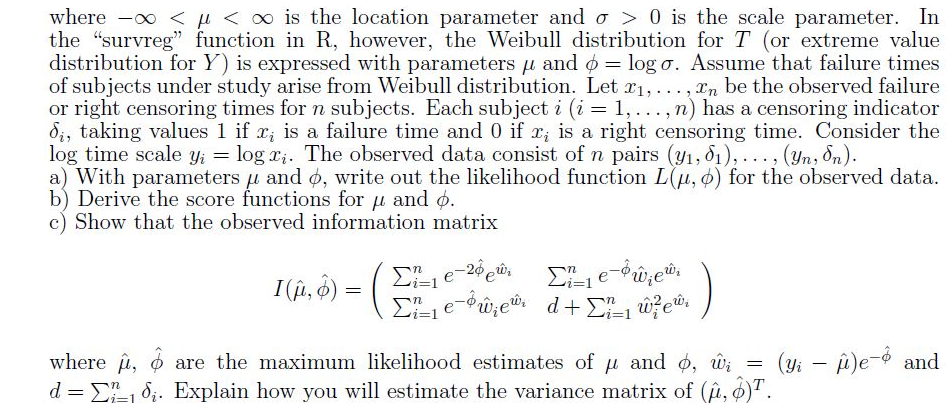
2. Likelihood Method for Weibull Model in R. Let T be a failure time following a Weibull distribution. Consider the log failure time Y = log T. It is known that Y has an extreme value distribution with survival function
3. The following data consists of the times in months) to relapse of 10 leukemia patients who had bone marrow transplantation. Starred observations are censoring times.
5, 8, 12, 24, 32, 17, 16*, 17*, 19*, 30*
a) Assume that the time to relapse has an exponential distribution with hazard rate λ. Construct the likelihood function for λ. Find the maximum likelihood estimate (m.l.e.) of λ and the m.l.e. of the mean relapse time of the patient population.
(b) Calculate by hand the K-M estimate of the survival function S(t) and the variance estimate of S(t).
(c) Find the nonparametric estimate for the mean relapse time of the patient population. Does this agree with the corresponding parametric estimate you find in (a)?
(d) Use R (or SAS) to plot the Nelson-Aalen estimate of the cumulative hazard function. On the same graph, plot also the estimated cumulative hazard function based on the exponential model in (a).
(e) Is it reasonable to make the exponential relapse time assumption in (a)? Why?
4. Leukemia Remission. The data below are remission times, in weeks, for a group of 30 patients with leukemia who were treated in a similar fashion. Asterisks denote censoring times.
1, 1, 2, 4, 4, 6, 6, 6, 7, 8, 9, 9, 10, 12, 13, 14, 18, 19, 24, 26, 29, 31*, 42, 45*, 50*, 57, 60, 71*, 85*, 91
Use R (or SAS) to analyze the data and answer the following questions.
(a) Obtain the Kaplan-Meier estimate and the Nelson-Aalen estimate of the survival function for remission time and plot them.
(b) Based on the K-M method, estimate the median remission time and find the approximate 95% confidence interval for the survival probability at the median remission time; also find the approximate 95% confidence interval for the probability that remission lasts over 25 weeks. Find both the plain confidence intervals, and the log(-log-based confidence intervals.
(c) Plot the N-A estimate of the cumulative hazard function for remission time. Comment on the shape of the estimated H(t). What will be an appropriate family of (parametric) distribution to model the remission time?
Students succeed in their courses by connecting and communicating with an expert until they receive help on their questions

Consult our trusted tutors.


 Login | Sign Up

