1.4. The world's 10 largest companies yield the following data:
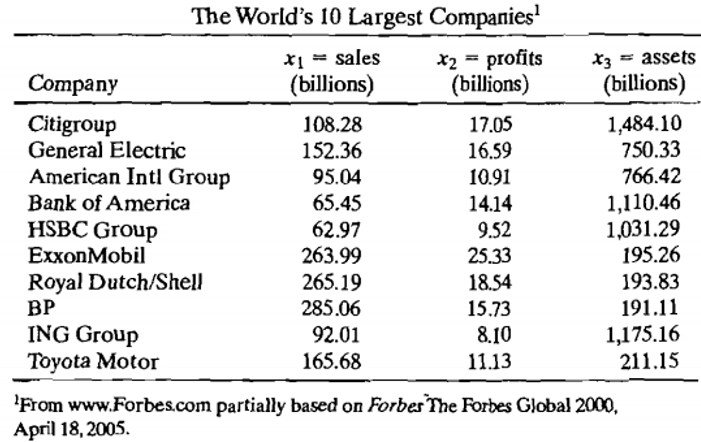
(a) Plot the scatter diagram and marginal dot diagrams for variables x1 and x2. Comment on the appearance of the diagrams.
(b) Compute 
Students succeed in their courses by connecting and communicating with an expert until they receive help on their questions

Consult our trusted tutors.


 Login | Sign Up

