Be Prepared For The Toughest Questions
Practice Problems
Assignment Four: Using Lambda to analyze and interpret associations between two nominal variables
Part I: Use APA style and formatting for all assignments, references, and citations. Try Purdue Owl for an example APA style paper: https://owl.english.purdue.edu/owl/resource/560/18/
Part I: Lambda and bivariate analysis of two nominal variables
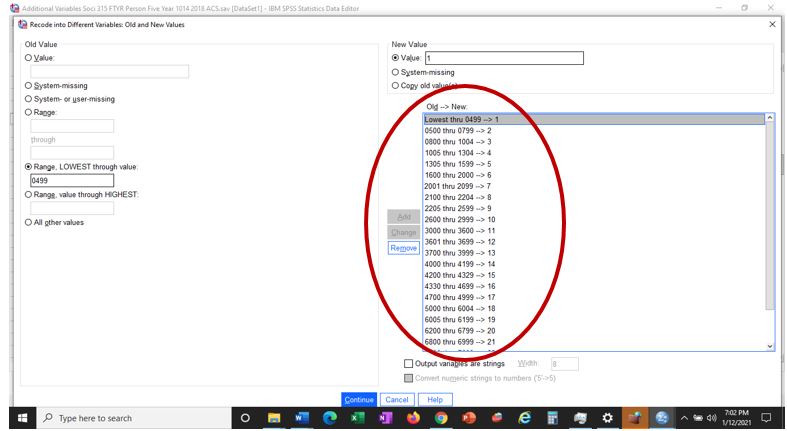
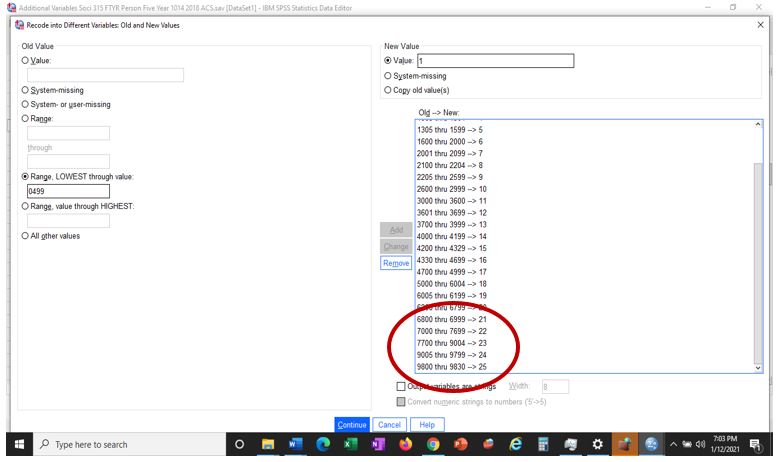
1. Using the ACS 2018-2022 dataset recode occp into a new variable called occcat. You have done this recoding procedure before. If you need a refresher, then check chapter seven and/or your last assignment. Step-by-step recoding document is also under course materials. Below are the categories I want you to recode occp into. We are going to end up with 25 occupational categories after we recode occp.
You enter each new value one-by-one and then click add after each. I used the ACS data dictionary, available to you in course materials, to choose the values I wanted recoded into larger occupational categories. See occp beginning on page 87 if you are interested. Note: there are so many categories, I have to give you two screen shots so you can view all of the values to create the categories. Tip: having trouble seeing the categories? You can stretch the images so you can see them better or increase magnification in word.
Once you finish and hit continue, you will have transformed hundreds of detailed occupational categories into just 25, a number much easier to interpret in frequency tables and output, right?
Note: Some of you may notice that the occupational category numbers do not have an occupational category. Well, occupational categories change overtime, right. We didn’t used to have computer programmers. They had to be added. And, perhaps at one time we had switchboard operators, but not anymore. Or, the Census changes the categories in some other way, for example by combining them. So, what you are seeing are the most recent occupational categories.
Make sure to save your work.
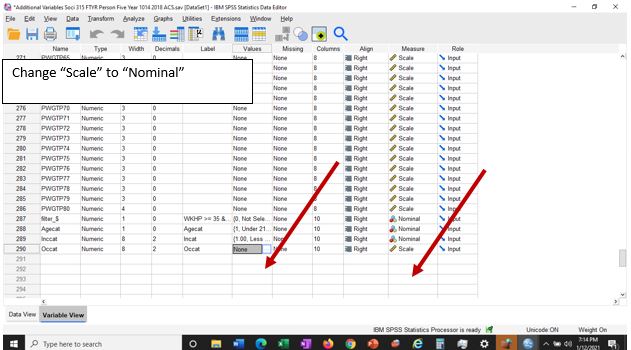
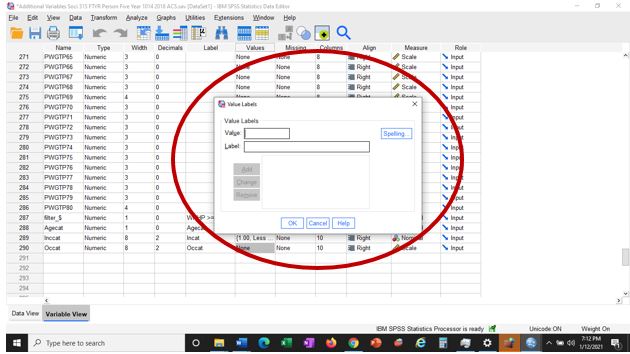
2. That said, we still don’t know which occupations are represented by each of the new numbers 1-25. So let’s add value labels to each of the numbers. See screen shots below to know where to click and the window that will open so you can input the values I give to you one-by-one. First, change the measure to nominal. Then click into your new variable occcat’s values.
Once you do, the following box pops up:
3. Now input the following information into the “Value” and Label” areas before clicking on “add.”
Value=1, Label=Manager
Value=2, Label =Business
Value=3, Label=Finance
Value=4, Label=Computer
Value=5, Label=Engineer
Value=6, Label=Science
Value=7, Label=Community Service
Value=8, Label=Legal
Value=9, Label=Education
Value=10, Label=Entertainment
Value=11, Label=Medicine
Value=12, Label=Health Service
Value=13, Label=Protection
Value=14, Label=Food Service
Value=15, Label=Cleaning
Value=16, Label=Personal Care
Value=17, Label=Retail Sales
Value=18, Label=Office
Value=19, Label=Farm Fish Forest
Value=20, Label=Construction
Value=21, Label=Extraction
Value=22, Label=Repair
Value=23, Label=Production
Value=24, Label=Transportation
Value=25, Label=Military
4. Once these labels are inputted, then click “OK,” and save your file, too.
Note: Some of you may have noticed there is a code for unemployed in the data dictionary for occupation. Remember I removed all of the unemployed people from our data file. It only has full-time, year-round workers who earn money in California. So, there should be no unemployed people in our file.
5. . Make sure you turn on your weight variable like you did last week. The weight variable is “Pwgtp.” Run frequency tables for occcat. Under statistics check off mean, median, and mode. Copy and paste the output table for mean, median, and mode you create. You should have no missing values.
6. Report the mean, median, and mode.
Mean:
Median:
Mode:
7. What does the mean tell us about the occupation?
8. What does the median tell us about the occupation?
9. What does the mode tell us?
10. For this variable, occcat, which measure of central tendency tells us the most useful information? Hint: You will need to look back at the values and labels above.
11. What kind of measure is occcat and what kind of variable is sex (i.e., nominal, ordinal, interval/ ratio)? Hint: they have to both be nominal to use Lambda as a measure of association. I chose them that way.
occat:
sex:
12. Which one is your independent and dependent variable?
Independent:
Dependent:
13. Follow the directions for demonstration 13.1 in your text but for sex and occat. Copy and paste the directional measure table into your word document. If your table goes off the screen, then select the table and right click on it, then under “autofit” click “autofit to window.”
14. What is the value of Lamda for our dependent variable? Hint: You have to know which variable is your dependent variable.
15. Complete this sentence, knowing the sex category of a person allows us to predict his or her occupation ____% more accurately.
16. What is the strength of the Lambda association you just reported, according to your text?
17. Would you say there is a relationship between the variables? How come or not?
18. Would you say that sex category causes occupation? How come or not?
19. Given this assignment, how come I am so adamant about you being able to identify the different measures for each variable (i.e., nominal, ordinal, interval, and ratio)?
20. Given this assignment, how come I am so adamant about you understanding which variables are independent and which one is dependent?
21. If we used sex and inccat (i.e., the ordinal variable we created last week), what would be a better measure of association according to your text? Hint: Look ahead in the reading a little.
Know the process
Students succeed in their courses by connecting and communicating with
an expert until they receive help on their questions

Unable to find what you’re looking for?
Consult our trusted tutors.


 Login | Sign Up


