The Capital asset pricing model (CAPM) takes into account the stock's sensitivity to nondiversifiable risk
Question C – Stock Markets
Introduction The Capital asset pricing model (CAPM) takes into account the stock's sensitivity to non diversifiable risk (also known as systematic risk or market risk), often represented by b in the financial industry, as well as the expected return of the market and the expected return of a theoretical risk-free asset. CAPM shows that the cost of equity capital is determined only by beta. Despite it being invented in the 1960s, the CAPM still remains popular due to its simplicity and applicability in a variety of situations. It may be a good idea to check out Understanding Beta at http://www.investopedia.com/video/play/understanding-beta/. The CAPM is a model for pricing an individual security or portfolio. The risk of a portfolio comprises systematic risk, also known as undiversifiable risk, and unsystematic risk which is also known as idiosyncratic risk or diversifiable risk. Systematic risk refers to the risk common to all securities—i.e. market risk. Unsystematic risk is the risk associated with individual assets. Unsystematic risk can be diversified away to smaller levels by including a greater number of assets in the portfolio (specific risks "average out"). The same is not possible for systematic risk within one market. Depending on the market, a portfolio of approximately 20 securities would be sufficiently diversified. The beta from a single factor model in the form
is a good approximation to the CAPM beta. The basic idea is that stocks tend to move
together, driven by the same economic forces (the market). Here, the dependent variable, ri are percentage returns for stock i, and independent variable, rm are percentage returns for a broad market
index. ai is the
intercept and bi is the slope of the linear relationship between the
stock returns and the market. ei are
the residual returns that cannot be explained by the market fluctuation (this is your idiosyncratic or firm-specific
fluctuations). In the file Assignment Data.xlsx, tab:ASX200 stocks (Price
Indices), you
will find price indices for 189 stocks as well as the
S&P/ASX 200 Index (a benchmark for the Australian stock market) from July 1, 2015 to June 30,
2018. 1. Pick any 3 securities making sure they are
from different industries (full name, industry and sector information are provided in column
headings). 2. Convert your chosen security price indices
and the market index into percentage returns. For each asset/index, percentage returns are defined as 
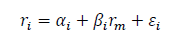
This will define your returns for the three stocks, ri, and the market return rm. C1. Perform OLS
regression for each stock separately and report regression outputs for the three models from
Excel/Matlab including line fit plots and residual plots. C2. For each stock,
discuss the OLS assumptions and violations (if any) based on the results from C1. C3. Discuss the
estimated betas for your three stocks and their statistical significance. Are these betas in line with
your expectations? Provide your reasoning. What does it mean if a stock has a beta equal
to 1? What does it mean if a stock has a beta equal to zero? C4. Discuss the
measure of fit (R2) of your regressions in C1. Are these R2 in line with your expectations? Provide your
reasoning. Note that R2 gives the fraction of the variance of the dependent variable (the
return on a stock/portfolio of stocks) that is explained by movements in the independent
variable (the return on the market index). C5. (2 marks) Construct an
equally weighted portfolio consisting of your three chosen stocks (equally weighted portfolio returns
are simply the average of individual stock returns in that portfolio, ) and find the portfolio beta. Report
regression output (including line fit plots and residual
plots), assess the OLS assumptions and violations (if any) and discuss the estimated portfolio beta
and the measure of fit of your regression. How does the measure of fit for the portfolio
compares with the measures of fit for your individual stocks? Comment on portfolio diversification
effect using your R2s.
Hint
The regression model is easy to use and apply but the major limitation is that regression will give correct results only if dependent and independent variables are correlated to each other.One of the assumptions is regression model should not have multi-co-linearity, which means independent variables will not be correlated to each otherOther assumptions involve there should be no autocor...
The regression model is easy to use and apply but the major limitation is that regression will give correct results only if dependent and independent variables are correlated to each other.
One of the assumptions is regression model should not have multi-co-linearity, which means independent variables will not be correlated to each other
Other assumptions involve there should be no autocorrelation, that is error terms in prediction must not be correlated with each other.
The variance of error terms must be constant, that there should not be hetero-scedasticity.