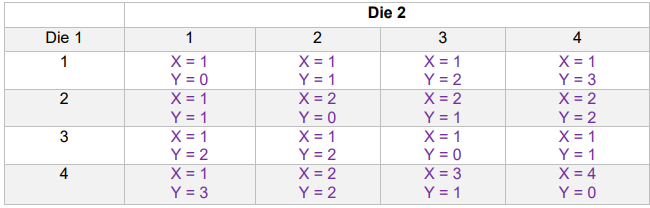
Problem 1 (Discrete Random Variables): Define the random experiment: Roll two four-sided dice.
Define X = Minimum (Die 1, Die 2).
Define Y = |Die 1 – Die 2|.
a) Sketch the PDF of X.
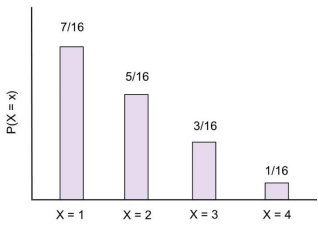
b) Compute E(X).
c) Sketch the PDF of Y.
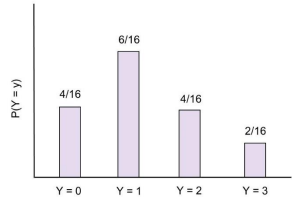
d) Compute E(Y).
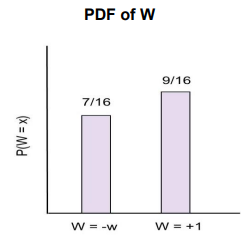
Problem 2 (Expected Value and Variance): The following graph depicts the probability distribution function (PDF) for the random variable X.
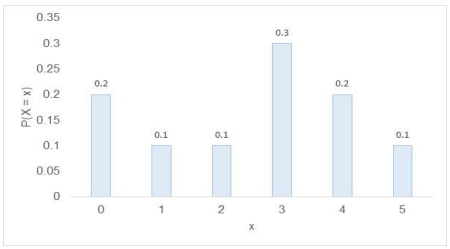
a) Compute E(X).
b) Compute Var(X).
Var(X) = E(X – E(X)) 2
OR Var(X) = E(X2 ) – E(X)2
Problem 3 (Expected Value): Define the random experiment: Roll two four-sided dice. Define X = Minimum (Die 1, Die 2). How much would you be willing to wager ($w) that X is greater than 1? You will win $1 if you are correct and lose your wager if you are incorrect.
Problem 4 (Expected Value): You attend a summer fair event at which one of the booths is the game “Skee-Ball”. For $2, you can purchase 3 balls and have 3 opportunities to roll each ball into a centrally located target. You will receive your $2 back and win an additional $1 if you hit the target once, an additional $3 if you hit the target twice and an additional $5 if you hit the target three times. If you do not hit the target at all, you will lose your initial $2. Define the following random variables and their probability distributions.
Let X = Number of balls that hit the target for an average player:
Let W = Average Player’s Winnings
P(W = -2) = P(X = 0) = 0.512
P(W = +1) = P(X = 1) = 0.384
P(W = +3) = P(X = 2) = 0.096
P(W = +5) = P(X = 3) = 0.008
True or False, the game is profitable for an average player?
Students succeed in their courses by connecting and communicating with an expert until they receive help on their questions

Consult our trusted tutors.


 Login | Sign Up

