2. Use SPSS Chart Builder to create a Simple Scatterplot depicting the linear relationship between BMI and Self-Esteem.
a. Go to Graphs - Chart Builder… and click OK.
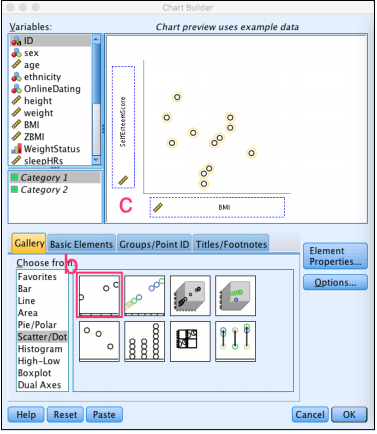
b. From the list of options in the bottom, left-hand corner of the Chart Builder, select Scatter / Dot. Then click on a Simple Scatter chart, and drag and drop it into the Canvas above.
c. In the list of variables, drag and drop the predictor variable BMI onto the x-axis in the Canvas, and drag and drop the SelfEsteemScore variable onto the y-axis in the Canvas.
d. In the main menu box, click OK to create the Scatterplot Figure in your output.
e. In your output, edit the bar graph using the SPSS Chart Editor to be in appropriate formatting for reporting.
f. Also, in the SPSS Chart Editor, add the regression line to the scatterplot by going to the Elements drop-down menu and selecting Fit Line at Total
g. Once the scatterplot is edited, right-click on the bar chart in your Output and select Copy. Paste the figure into your written response worksheet as part of your answer to Question #5 and use the figure to answer Question #6
QUESTION 5
Paste the scatterplot figure you created showing the relationship between body mass index and self-esteem. Include an APA-style title with the figure.
QUESTION 6
Describe the nature of the relationship between body mass index and self-esteem score based on
the scatterplot figure. What is the direction and strength of the relationship?
Students succeed in their courses by connecting and communicating with an expert until they receive help on their questions

Consult our trusted tutors.


 Login | Sign Up

