Part B: Leaky Integrate-and-Fire neuron model
*** Remember to include: 1. your code (as an appendix) and 2. a statement of collaboration. ***
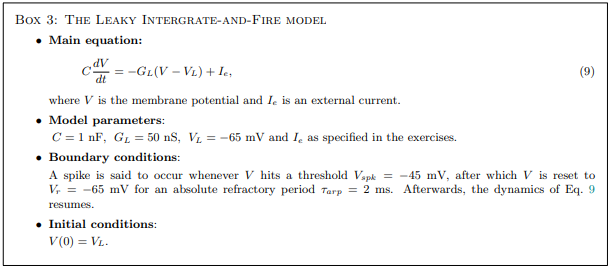
Consider the leaky integrate-and-fire (LIF) neuron model as defined in Box 3
1. (Main simulation) Repeat Exercise 1 of Part A for the LIF neuron: replace the equations for the HH model with the equations for the LIF neuron (remember to include the boundary conditions for the emission of a spike) and repeat the same exercise. This time, use the forward Euler algorithm with time step dt = 0.1 ms and choose a value for Ie = 1.1 nA. Plot, in the same figure but in two different subplots: the membrane potential vs. time and the external current vs. time. Include the plot in your report.
Note The boundary conditions amount to a mechanism of spike initiation followed by clamping the membrane potential to the reset value for some time. In the LIF neuron, the time of spike initiation is also the time of spike detection (compare with Exercise 2 of Part A). If you found a way to detect each spike only once in Exercise 2 of Part A, the same code can be used to implement the refractory period here. But remember that in this case V = Vr during the refractory period.
2. (f − I curve) Repeat Exercise 5 of Part A for the LIF neuron. Use at least 40 different values for the current. Make sure to use currents which elicit a range of firing rates from zero to at least 60 or 70 spikes/s. Plot the f − I curve and include the plot in your report. Answer the following questions in your report:
i) What type of f − I curve do you observe in this case? Is this different from the f − I curve of the HH model? In what way?
ii) Is it possible, in the LIF model, to have only a few action potentials and then stop firing?
iii) From the f − I plot, locate the rheobase current (analogous to Irh in Part A) and compare it with the theoretical rheobase current given by I LIF rh = GL(Vspk − VL). Do they match?
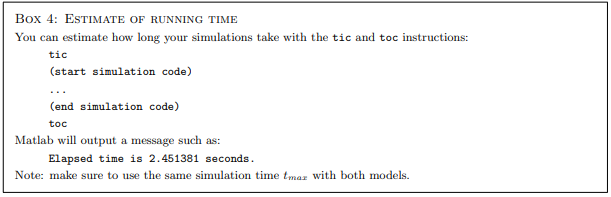
3. (Running time) Answer the following questions:
i) Do your simulations of the HH model work if you use dt = 0.1 ms? And if you use dt = 0.05 ms? Include one plot in your report.
ii) Do your LIF neuron results change significantly when you use dt = 0.2 ms instead of dt = 0.1 ms?
iii) Run both the LIF and the HH model with dt = 0.01 ms and dt = 0.002 ms, and measure how long each simulation takes (see Box 4). Log these values in your report. Is there an appreciable difference in running times between the HH and the LIF model neurons, at parity of dt? Which one runs faster? Is there a big difference?
Students succeed in their courses by connecting and communicating with an expert until they receive help on their questions

Consult our trusted tutors.


 Login | Sign Up

