I. Confidence Intervals and Hypothesis Tests
You wish to assess support among UCSD students for recalling Governor Newsom. You take a simple random sample of 600 UCSD students and find that 250 support the recall and 350 oppose such a ban.
i. Calculate a 95% Confidence Interval for the Proportion of UCSD students that support the recall of Governor Newsom. Do this by hand and show your work. What does the confidence interval tell us, and what does “95% confident” mean?
Next, you decide to investigate what non-student members of the community think. You are almost out of money, so you take small simple random sample of all San Diegans. You measure Respondent Party (Democrat, Republican, Independent) and Opinion on Recall of the Governor, and you find the following:
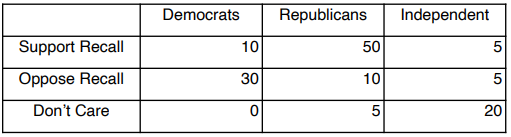
ii. Calculate appropriate percentages in the table above, and justify your choice. Explain the relationship between the two variables (Respondent Type and Opinion).
iii. Use the chi-square test to determine whether there is a relationship between
Respondent Type and Opinion. Do this by hand and show your work! Include all
three values for opinion - don’t drop the “Don’t Care” respondents. Calculate the
chi-square statistic, see if it is significant, and state your conclusion.
Students succeed in their courses by connecting and communicating with an expert until they receive help on their questions

Consult our trusted tutors.


 Login | Sign Up

