TOPIC: Descriptive Statistics
Your first IBM SPSS assignment includes two sections in which you will do the following:
Create two histograms.
Calculate measures of central tendency and dispersion.
As you work on this assignment, you may find the Data Set Instructions [DOCX] helpful. Provide a title for your document
The grades.sav file is a sample SPSS data set. The data represent a teacher's recording of student demographics and performance on quizzes and a final exam. you will create and describe two histograms and a descriptives table using these data.
Part 1
Create two histograms for visual interpretation using the following variables:
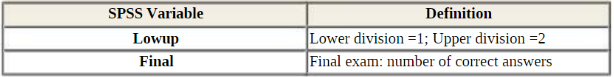
Create two histograms and paste them into your Word document:
A histogram for lower division students.
A histogram for upper division students.
Briefly describe what a visual inspection of this output tells you about the nature of the curves.
Part 2
Create a descriptives table to assess measures of central tendency and dispersion using the following variables:
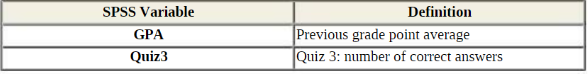
Create a descriptives table and paste it into your Word document.
Under the table:
Report the mean, standard deviation, skewness, and kurtosis for GPA and quiz3.
Briefly describe what skewness and kurtosis tell you about these data with regard to normality.
Students succeed in their courses by connecting and communicating with an expert until they receive help on their questions

Consult our trusted tutors.


 Login | Sign Up

