Analysing the disparity between GDP per capita growth rates among countries and the relationship between GDP per capita growth and Manufacturing Share of GDP.
Your statistics coursework data file contains macroeconomic data for 102 countries from the World Bank Development Indicators. Your data file consists of GDP per capita growth rate % (GDP), Manufacturing share of GDP % (MG), and total population level (POP) for 2018. The 102 countries consist of 21 high income (HI) countries and 81 low/middle income (LMI) countries. Students have different datasets such that your set of countries will differ.
Your coursework should contain no more than 1,500 words - excluding figures, tables, charts, formulas and references.
In all the following questions ensure you demonstrate comprehension of the statistical methods and formula employed and discuss your answers. All final numerical answers should be to 3 decimal places at most.
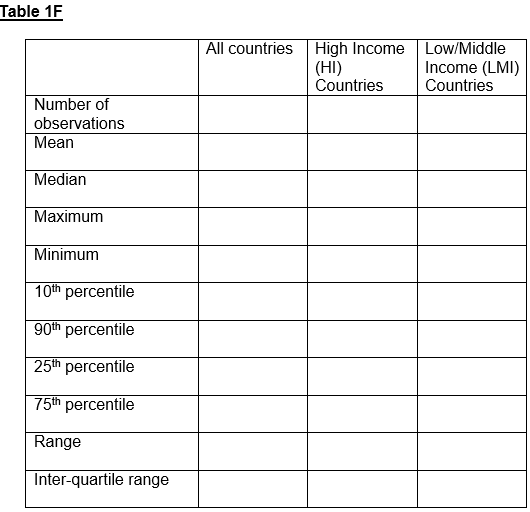
1. Create three Box Plot diagrams for GDP growth rate for HI, LMI and all countries respectively. Also summarize the key corresponding figures in table 1F below.
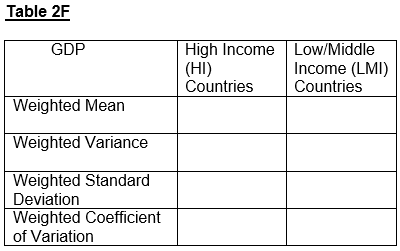
2. Separate the countries into HI and LMI countries, and assign a proportional weight to each country according to their relative population size within their group. Find the weighted mean, variance, standard deviation, and coefficient of variation of GDP for HI and LMI countries respectively. Also write the final results in table 2F. Please discuss why these measures are useful, and their limitations.
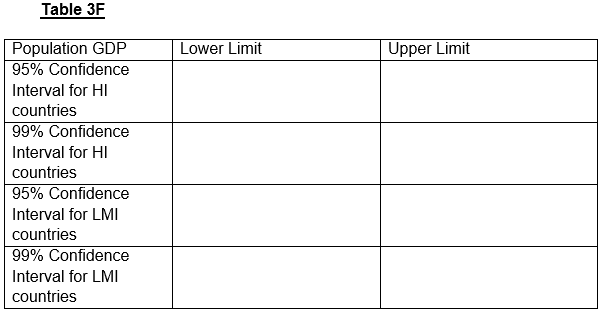
3. Find the 95% and 99% confidence Intervals for the population mean for GDP for HI and LMI Countries respectively. Also write the key figures in table 3F.
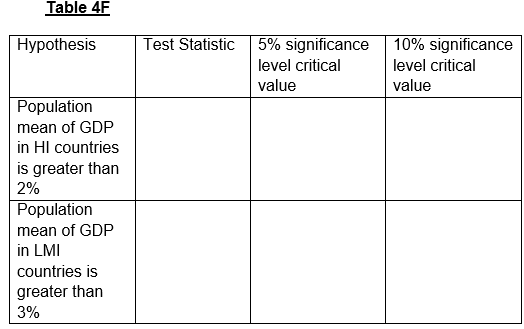
4. Test the hypothesis that the population mean of GDP in HI countries is greater than 2% at the 5% and 10% levels of significance. Also test the hypothesis that the population mean of GDP in LMI countries is greater than 3% at the 5% and 10% levels of significance. Write the key numerical results in table 4F. What are your conclusions?
5. What assumptions have you implicitly made in your answers to 3. and 4.? Are these assumptions valid?
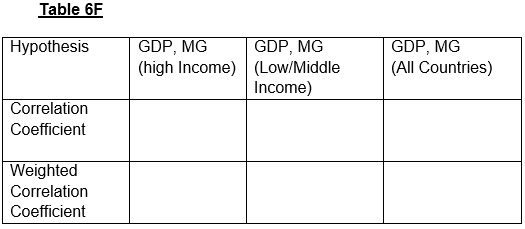
6. Create three scatter plots, plotting GDP against MG, for HI, LMI and all countries respectively. First find the correlation coefficient between GDP and MG, for HI, LMI, and all countries respectively. Second find the weighted correlation coefficient, weighted by relative population levels, between GDP and MG, for HI, LMI and all countries respectively. Write the final results in table 6F below. Discuss the results.
Students succeed in their courses by connecting and communicating with an expert until they receive help on their questions

Consult our trusted tutors.


 Login | Sign Up

