Data
The data in this problem were collected by two economists to be used in constructing a regression equation to serve as a price index for owner-occupied housing in a region containing a large U.S. city. Data were obtained for each of 506 census tracts in and around the city. (The U.S. Census Bureau has partitioned the entire country into geographical regions, called census tracts that contain about the same number of people.) The values for some variables were reported on a census tract basis while other variables were reported on a community basis. For example, the property tax rate is determined by each community. If a community consists of more than one census tract, the property tax rate will be the same for each census tract in that community. Note that census tracts between 357 and 488, inclusive, are all part of the city. The other census tracts are in towns or suburbs in the surrounding metropolitan area, but they are not in the city. Census tracts in the city have the same values for the property tax, pupil-teacher ratio, zoning and highway access variables. The data for the 506 census tracks are in the attached data file ‘student data.csv’, although you should note that the last 50 data points have missing Y values. There is one line of data for each census tract. Values for the variables appear in the order they are listed in the following table. Use these variable names in formulas and tables presented in your report.
With the exception of Census Tract, which is a three digit identification, the variables are described below.
Y: The median value of owner-occupied homes in the census tract.
X1: Per capita crime rate in the community. Assuming crime rates are related to people’s perception of danger, areas with higher crime rates may have lower median housing values.
X2: Percentage of a community’s residential land zoned for lots greater than 25,000 square feet.
X3: Percentage of acres in the community zoned for non-retail business. This variable serves as a proxy for variables associated with industry such as noise, heavy traffic, ugly buildings, etc. and could have a negative correlation with housing values.
X4: A dummy variable with value 1 if the tract borders a specific river and with value 0 otherwise. Locations of homes along some sections of this river are very desirable.
X5: The average concentration (parts per 100 million) of nitrogen oxides in the air. This is a measure of the level of air pollution.
X6: The average number of rooms per owner-occupied home. This variable represents the average size of homes.
X7: Percentage of owner-occupied homes that are more than thirty years old.
X8: Natural logarithm of the weighted distances to five major employment centers in the metropolitan area. A larger value indicates that the census tract is farther away from the major employment centers. According to traditional theories housing values should be higher near employment centers.
X9: Natural logarithm of an index of accessibility to radial highways that is calculated on a community basis. Larger values represent better access to major highways.
X10: Property tax rate (in dollars) per $10,000 of property value. This measures costs paid by homeowners to maintain schools and public services in each community. Higher values may indicate better public services such as police and fire protection, libraries, quality of roads, busses and other public transportation, or higher values may represent more expensive and less efficient delivery of public services.
X11: Pupil-teacher ratio in each school district. Lower values of this variable may represent higher quality of primary and secondary education.
X12: The percentage of the population in the census tract of lower socio-economic status (percentage adults without a high school diploma or classified as laborers).
Task
Your task is to analyze the data for the 456 census tracks for which you have complete data and construct one or more good regression models for predicting Y , the median value of owner-occupied homes. You may include additional explanatory variables constructed from functions of the variables on the data file if you think they are worthwhile. You should summarize your analysis in a report that includes the following discussions.
1. Provide a one-two paragraph “Executive Summary” of your major conclusions about the relationships between median housing prices and the explanatory variables with some mention of the nitrogen oxide variable. This should not contain any formulas or mathematical symbols. It should be written so that it could be easily understood by a real estate investor with no formal training in statistics.
2. Provide a description of the steps taken to identify your best model (or models). Do not submit any python output in this section, but graphical analysis and summary statistics are encouraged. Simply outline the issues you considered, your decisions, and the sequence of steps you took to develop a model. Be detailed – tell me what you did, why you did it and if it worked.
(a) For the purposes of this course, consider only models with main effects, quadratic effects (X2 ) and following interactions: X1 ∗ X5, X4 ∗ X5, X5 ∗ X6, X5 ∗ X8. This should be “reasonable” while still forcing you to explore the model building process.
(b) Because of this model limitation, it is possible that there may be some higher order effects and/or non-linearity in the data that you cannot model because I have limited the variables under consideration. Remember this when looking at residual plots scatter plots. Point out if you think there may be deficiencies caused in this way. You may and should transform Y if you deem it necessary/useful.
3. Provide a formula for your best model (or models), standard errors for coefficients, and the R2 value. You can summarize python results in tables of your own creation. Discuss and interpret any important features of your model. Pay some attention to the nitrogen oxide (air pollution) variable as a predictor of median housing values, although you may conclude that it is not important.
4. Provide convincing evidence that the model you selected is a good model for using some or all of the twelve explanatory variables to predict median housing values. Discussion of residual plots and other diagnostic checks would be appropriate. Statistical tests should be formulated correctly with appropriate hypotheses and conclusions. You may attach graphs or tables, but lists of raw python output should not be submitted and will be ignored.
5. You may submit one more paragraph outlining additional analyses that you would have done if you had more time. You will earn points for good suggestions and lose points for suggestions with little potential value.
6. The last output you must provide is a set of predictions for the missing Y data points (the last 50
observations). Use your final, best model to predict Y and create a 95% prediction interval. Points for
the “Predictive Ability” section will be based on 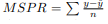 (lower is better) coverage of your
confidence intervals (95% intervals → 2-3 missed intervals due to random error), and the width of your
confidence intervals (more narrow = better so long as coverage is okay).
(lower is better) coverage of your
confidence intervals (95% intervals → 2-3 missed intervals due to random error), and the width of your
confidence intervals (more narrow = better so long as coverage is okay).
Students succeed in their courses by connecting and communicating with an expert until they receive help on their questions

Consult our trusted tutors.


 Login | Sign Up

