Your task is to apply the Market Model for each stock’s returns and the TSX Index returns. Do a complete regression analysis for each stock, following the analysis steps provided in the study guide and presented in the course materials. Write a report describing the analyses conducted. For the beta coefficient and coefficient of determination, you should include both the basic statistical interpretation and a discussion with respect to the financial model. In your conclusion, provide a summary table of all relevant parameters and discuss which stocks are most and least sensitive to changes in the index. Also explain which stocks’ risk could be diversified by creating an appropriate portfolio. You do not need to develop a portfolio.
Note that the last step "7 If the model fits the data, use the regression equation.” is not directly applicable other than your explanations of sensitivity and risk. This step really applies to using the model for prediction.
You should use the p-value criterion for any hypothesis tests conducted. Use only summary tables within the text of your report. If any data is within your text, it should be something you are discussing!! I do not need to see the raw data anywhere. You can include your Excel output in an Appendix if you like and refer to it there.
The case should be organized by regression steps (including all 3 stocks’ graphs together or a table of values for all 3 in one place, followed by discussion) rather than by stock, you can use one summary paragraph to explain the your analysis for each step. This eliminates a lot of the repetition that results when organizing by individual stock.
Students succeed in their courses by connecting and communicating with an expert until they receive help on their questions

Consult our trusted tutors.
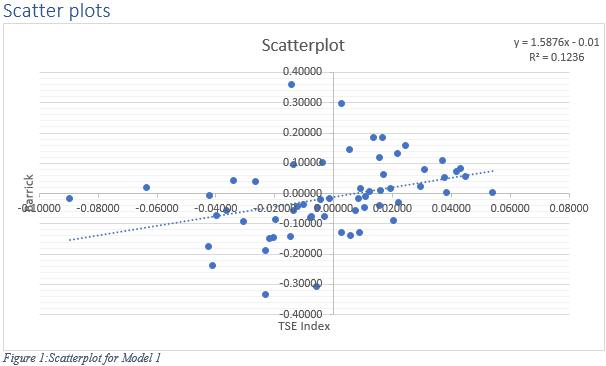
Linear Regression analysis is conducted and comparison among three models is carried. In model 1, the dependent variable is return on Barrick stock and the independent variable is return on TSE Index. In model 2, the dependent variable is return on BMO and the independent variable is return on TSE Index. In model 3, the dependent variable is return on ENB and the independent variable is return on TSE Index.


 Login | Sign Up

