Quantitative measures
What is the difference between Discrete and Continuous Variables?
Discrete variables: Variables which can take only finite (specific) number of values or are countable are referred to as discrete variables. For reference, a discrete variable can take values 1, 2, 3, … , 10. Example, the outcome of a flip of a coin, number of marbles in a glass jar etc.
Continuous variables: A variable which has an infinite number of possible values or whose values can be measured is referred to as continuous variables. For reference, a continuous variable can take values between 1 – 2 that is 1.02, 1.08. Example income, weight, age, height etc.
What is the difference between Quantitative and Qualitative Variables?
Quantitative variables: Variables which are measured on the numeric and quantitative scale are referred to as quantitative variables. Variables measured on ordinal, interval and ratio scale of measurements are quantitative variables. For example height, weight, age etc.
Qualitative variables: Variables that are not numerical but are categorical in nature are qualitative variables. Variables measured on a binary and nominal scale of measurement are qualitative variables. for example gender, eye color, religion etc.
What are the various Measurements of Scale?
Nominal scale of measurement: This includes variables that are categorical in nature. Example Gender, location, religion and Favorite Color.
Ordinal scale of measurement: These are the variables that can be ordered or ranked in some order of importance. Example Quality of product, Satisfactory Level is measured on the ordinal scale of measurement.
Interval scale of measurement: Variables which have equal differences between scale values and equal quantitative meaning are measured on an interval scale of measurement. It does not have a true zero point. A true zero point means that a value of zero on the scale represents zero quantity of the construct being assessed. Example Temperature. Zero degrees Celsius doesn’t mean there is absolutely no heat present in the environment.
Ratio scale of measurement: These variables have equal differences between scale values and equal quantitative meaning. They also have a true zero point. A true zero point means that a value of zero on the scale represents zero quantity of the construct being assessed. Example Height and Weight of a person is a measured on ratio scale of measurement. It is suitable to say that a person of height 8” is twice as tall as a person with height 4” inches and a person with weight 60 kg is twice as heavy as a person with weight 30 kg.
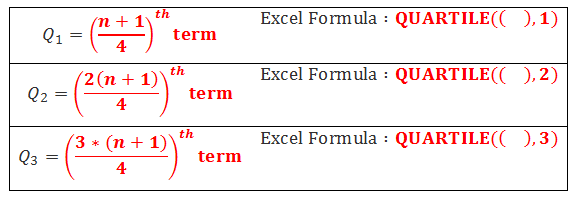
Frequencies, Percentiles and Quartiles
Charts And Graphs
Stem and Leaf Plot
The stem is used to group the scores and each leaf indicates the individual scores within each group. Example:

Histogram
The histogram is a graphical display of frequency distribution of data. The easiest method for construction if the histogram is using Pivot tables in Excel. Histogram tells me about the shape of the distribution.
Histogram can also be constructed with help of 2k Rule
The shape of the Histogram can be Symmetric (Normal), Positively skewed, negatively skewed and Bimodal.
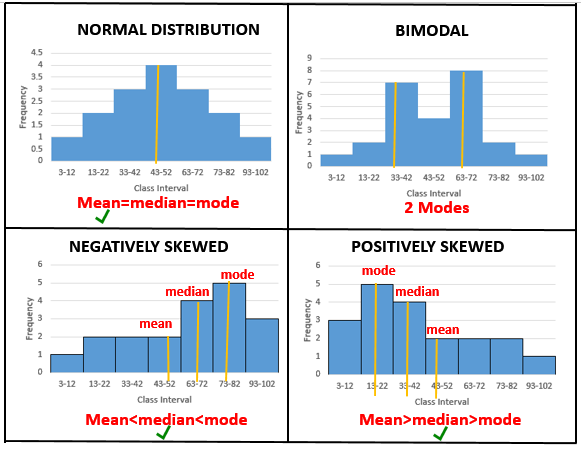
Symmetric (Normal): If it is bell-shaped I can say data is normally distributed. For a normal distribution, mean is the best measure of central tendency.
Positively skewed: If histogram has a tail toward the right, it is said to be skewed to the right. A positively skewed data implies that there are very few observations with high values. Here, mean is greater than median which is greater than the mode. For a skewed data, the median is the best measure of central tendency.
Negatively skewed: If histogram has a tail toward the left, it is said to be skewed to the left. A negatively skewed data implies that there are very few observations with low values. Mean is less than median which is less than the mode. For a skewed data, the median is the best measure of central tendency.
Bimodal: Here 2 modes can be observed.
Box Plot
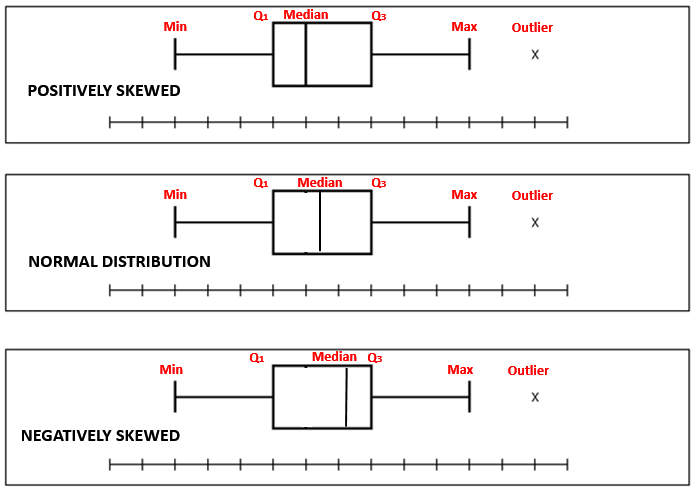
Box-plot indicates if there are any outliers in the dataset. Any point outside the box is considered as an outliers. The lower line of the box is 1st Quartile, the middle line is the median and upper line is 3rd Quartile. Box Plot is also a measure of Symmetry.

Box Plot is also a measure of Symmetry. It can tell us about the shape of underlying distribution.
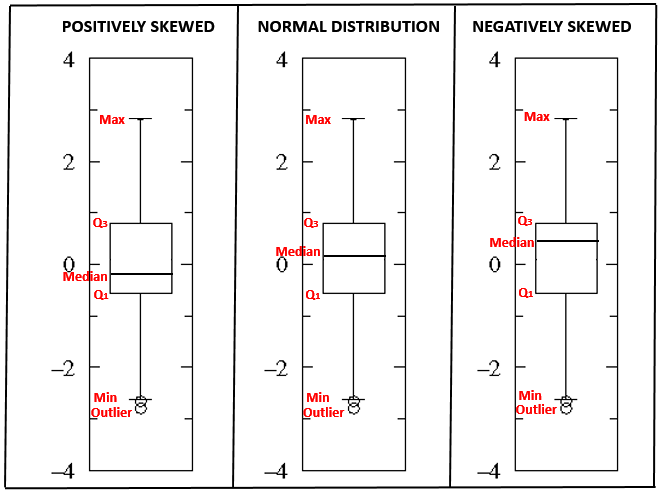
Normal Distribution: If the line is close to the center of the box and the whisker lengths are the same then the sample is from symmetric (Normal) population.
Positively skewed: If the top whisker is much longer than the bottom whisker and the line is gravitating towards the bottom of the box, then the sample is from a population which is skewed to the right.Here, mean is greater than median which is greater than the mode. For a skewed data, the median is the best measure of central tendency.
Negatively skewed: If the bottom whisker is much longer than the top whisker and the line is rising to the top of the box, then the sample is from the population which is skewed to the left. Here, mean is less than median which is less than the mode. Here, mean is less than median which is less than the mode. For a skewed data, the median is the best measure of central tendency.
PP Plot and QQ Plot
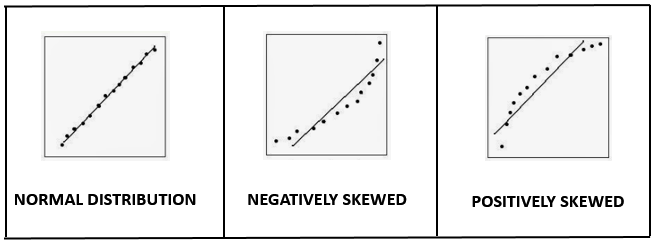
PP plot indicates whether data follows a normal distribution. If its graph is S-shaped, data is normally distributed. Else if data is not normally distributed. It plots the corresponding areas under the curve (cumulative distribution function).
QQ plot indicates whether data is skewed to right or left. Here the actual values of X are plotted against the theoretical values of X under the normal distribution. The use of Q–Q plots is to compare the distribution of a sample to a theoretical distribution, standard normal distribution.
Scatterplot
Scatterplot tells me strength and direction of the linear relationship between two variables.
An upward trend with all points close to each other -> strong positive linear relationship
An upward trend with all points not too close to each other -> moderate positive linear relationship
An upward trend with all points not close to each other -> weak positive linear relationship
Points arranged in a scattered manner -> no linear relationship
A downward trend with all points close to each other -> strong negative linear relationship
A downward trend with all points not too close to each other -> moderate negative linear relationship
A downward trend with all points not close to each other -> weak negative linear relationship


 Login | Sign Up


