10. Carl Lipke is the marketing VP for a propane gas distributor. He would like to have a forecast of sales on a quarterly basis, and he has asked you to prepare a time-series decomposition model. The data for 2005 through 2016 follow:(cop10)
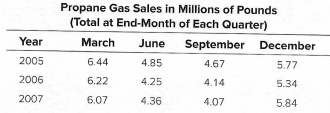
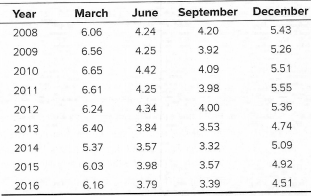
a. To help Carl Lipke see how propane gas sales have varied over the 12-year period, prepare a time-series plot of the raw data and the deseasonalized data (i.e., the centered moving averages).
b. Use ForecastXTM to find seasonal indices for quarters 1 through 4. Write a short para graph in which you explain to Carl Lipke exactly what these indices mean.
c. Plot the values of actual sales, the centered moving averages, and the trend. All of these can be found in your ForecastXTM results.
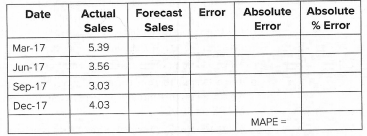
d. From ForecastXTM, get a forecast for 2017Q1 through 2017Q4 based on the time series decomposition model. Enter your forecast values into an Excel sheet that you set up like in the table shown below. Given the actual values shown in the table, calculate the mean absolute percentage error (MAPE) for 2017.
Students succeed in their courses by connecting and communicating with an expert until they receive help on their questions

Consult our trusted tutors.


 Login | Sign Up

