13. The following table contains quarterly data on Upper Midwest car sales (CS) in thousands for 1996Q1 through 2016Q4:
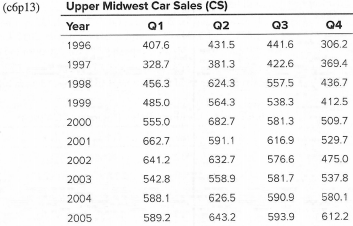
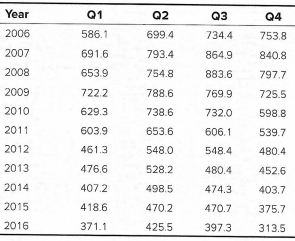
a. Prepare a time-series plot of Upper Midwest car sales from 1996Q1 through 2016Q4.
b. Use ForecastXTM to do a time-series decomposition forecast for 2017 (be sure to request the MAPE). In the results, you see the seasonal indices. Do they make sense? Why or why not?
c. ForecastXTM calculated the historic MAPE as a measure of fit. Write a short explanation of what this MAPE means to a manager.
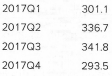
d. Now calculate the MAPE for the 2017Q1–2017Q4 forecast horizon as a measure of accuracy, given that the actual values of CS for 2017 were:
e. Prepare a Winters' exponential smoothing forecast of CS using data from 1996Q1 through 2016Q4 as the basis for a forecast of 2017Q1-2017Q4. Compare these results in terms of fit and accuracy with the results from the time-series decomposition forecast.
Students succeed in their courses by connecting and communicating with an expert until they receive help on their questions

Consult our trusted tutors.


 Login | Sign Up

