8. In a time-series decomposition of sales (in millions of units), the following trend has been estimated:
CMAT = 12.315 +0.196(7)
The seasonal indices have been found to be:
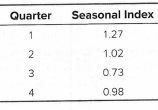
For the coming year, the time index and cycle factors are:
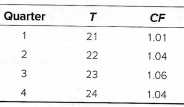
a. From this information, prepare a forecast for each quarter of the coming year.
b. Actual sales for the year you forecast in part (a) were 17.2, 13.2, 10.8, and 14.2 for quarters 1, 2, 3, and 4, respectively. Use these actual sales figures along with your forecasts to calculate the mean absolute percentage error for the forecast period.
9. A tanning parlor located in a major shopping center near a large New England city has the following history of customers over the last four years (data are in hundreds of customers):
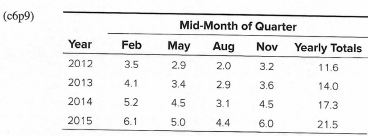
a. Construct a table in which you show the actual data (given in the table), the centered moving average, the centered moving-average trend, the seasonal factors, and the cycle factors for every quarter for which they can be calculated in years 2012 through 2015.
b. Look at the seasonal index for each quarter as calculated in ForecastXTM. Do they make sense to you? Explain why or why not.
c. Make a forecast of the number of customers for each quarter of 2016.
d. The actual numbers of customers served per quarter in 2016 were 6.8, 5.1, 4.7, and 6.5 for quarters 1 through 4, respectively (numbers are in hundreds). Calculate the MAPE for 2016.
e. Using the results provided in the tables produced by ForecastXTM, prepare a time series plot of the actual data, the centered moving averages, the long-term trend, and the values predicted by your model for 2012 through 2016 (where data are available).
Students succeed in their courses by connecting and communicating with an expert until they receive help on their questions

Consult our trusted tutors.


 Login | Sign Up

