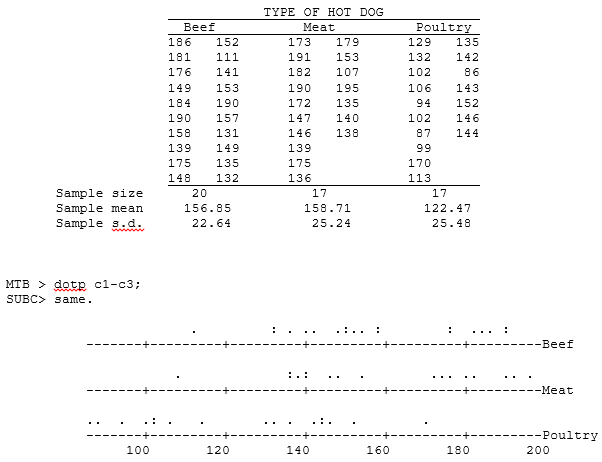
Introduction to Problems 4 and 5. In June 1986, Consumer Reports conducted a survey in which hot dogs of three types were sampled and measured for calorie content: All Beef, Meat (mainly pork, but may also contain beef and poultry), and Poultry. Although the survey was not conducted as a random sample of hot dogs of each type, we treat the data as if they are random samples from three normal distributions with equal variances. The data were entered into columns c1-c3 of a Minitab worksheet. The data and the results of several Minitab procedures are shown below.
4. The purpose of this problem is to say whether the population mean calorie level of beef hot dogs differs significantly from the mean level for meat hot dogs. For this problem completely ignore the data for the poultry hot dogs. Assume that the data are normal and that the population variances are equal.
(a) State the appropriate null hypothesis and its alternative both in symbols and in words. (Define symbols.)
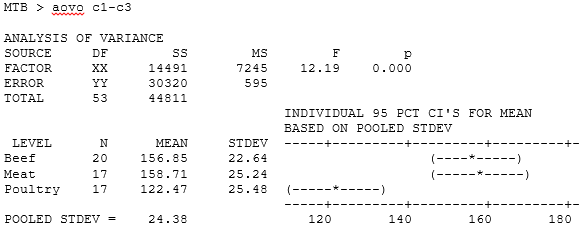
(b) Find the pooled estimate of the common population variance, using the sample standard deviations ("Sample s. d.") shown beneath the data table. (Show the method of computation and the answer.)
(c) Give the formula for the appropriate test statistic and compute its numerical value.
(d) Give the name of the distribution of the test statistic (including its degrees of freedom) and the rejection region for a test of your hypothesis at the 5% level of significance.
(e) State your conclusion both in statistical language (Fail to Reject or Reject) and in a plain English sentence that a typical (non-statistician) reader of Consumer Reports would understand.
(f) Based on your decision, what kind of error might you conceivably have made, Type I or Type II? Explain in plain English what it means to make this kind of error.
Students succeed in their courses by connecting and communicating with an expert until they receive help on their questions

Consult our trusted tutors.


 Login | Sign Up

